
Dashboard Design
Create visually compelling, interactive dashboards that communicate insights at a glance. We design dashboards optimised for different audiences and use cases, ensuring clarity and actionability.
Who we are, what we believe in, and the team driving Synapx forward.
The industries we serve and the outcomes we deliver across each sector.
Our Partner Programme: one agreement, with subcontracting and referral routes to grow together.
How Microsoft funding programmes can support your project, subject to Microsoft's eligibility and approval.
Join a team of Microsoft specialists building the future of data and AI.
Upcoming webinars, Microsoft In a Day workshops and executive briefings from our team.
Microsoft Power BI Consulting Services
Two dashboards, two different answers, and a meeting spent arguing about whose number is right. We build Power BI reporting on governed semantic models, so there is one version of the numbers and people actually use it.
The Future of Business Intelligence
You can tell reporting has broken down by the questions people ask: which spreadsheet is current, why finance and sales disagree, who exported this and when. This page is about fixing that. We design Power BI reporting your organisation trusts enough to run on, with interactive dashboards on top and governance underneath, rather than another export nobody maintains.
Most organisations do not lack data; they lack one place where it agrees with itself. Power BI brings your sources together at portfolio, programme or project level, so a leadership meeting starts from the same numbers the operational teams are looking at.
Our sweet spot is not the one-off dashboard; it is the governed foundation underneath: certified semantic models, workspace strategy, ALM and adoption, so the business can produce many reports safely instead of a few reports heroically. That discipline is also what makes Power BI Copilot-ready, because Copilot answers are only as good as the model it reads.
The credentials behind the practice are unusual: all three Microsoft Fabric featured-partner recognitions, making Synapx one of only 30 partners worldwide, out of 400,000+ Microsoft partners, to hold them. That matters because Power BI's future is Fabric. Direct Lake models over OneLake, capacity planning and licensing reviews come as standard. The Fidelis Partnership saved over £60,000 a year through exactly that licensing and governance work, and Mount Anvil cut report delivery times by 40% after we moved their estate onto a Fabric lakehouse.
Power BI and Fabric Credentials We Hold






Create visually compelling, interactive dashboards that communicate insights at a glance. We design dashboards optimised for different audiences and use cases, ensuring clarity and actionability.
Build comprehensive reports that drill down into data, answer key business questions, and support decision-making. Our reports combine analytics, storytelling, and interactivity to maximise impact.
Design efficient, scalable data models that support analytics and reporting at enterprise scale. We optimise query performance, establish relationships, and implement calculations that drive accurate insights.
Embed Power BI reports and dashboards directly into your applications, so users get analytics in the context they work in. We configure embedding, manage capacity, and make the experience feel native to your product.
Develop pixel-perfect paginated reports for formal reporting, compliance, and mass distribution. We create interactive reports optimised for PDF export, printing, and scheduled delivery.
Optimise report performance through efficient data models, query optimisation, and caching strategies. We monitor and tune your solutions to ensure fast load times and responsive interactivity.
Connectors to unify your data sources
of the Fortune 500 rely on Power BI
Consecutive years as Gartner BI leader
Microsoft Certifications
To a governed, production-ready Power BI estate
Faster decisions with a single semantic model
Reduction in conflicting numbers across the business
Aligned to Microsoft Fabric and Direct Lake
Get in-depth analysis of sales data, allowing your business to track performance metrics, identify trends, and uncover insights about your sales processes and team effectiveness.
Analyse purchasing patterns, customer demographics, and engagement data to tailor marketing campaigns, improve product offerings, and enhance customer experience.
Create interactive financial reports and dashboards to monitor key financial metrics. Track budget vs actuals and make informed financial decisions based on real-time data.
Analyse inventory levels, supplier performance, and logistics data to optimise inventory management, reduce costs, and improve supply chain efficiency.
Analyse employee performance, track recruitment metrics, and understand workforce demographics to inform talent management strategies and enhance workforce planning.
Analyse workflow data, identify bottlenecks, and track key performance indicators (KPIs) to streamline operations and enhance process efficiency across your organisation.
Workshops with report consumers and producers to understand the questions, data sources and governance needs.
Design the semantic model, security and refresh patterns in Fabric or Power BI Premium, using Direct Lake where appropriate.
Develop reports, scorecards and paginated reports with source control, ALM and automated testing of metrics.
Train users, monitor adoption and iterate on a continuous backlog driven by real business impact.
Interactive Analytics
Storage Mode
Storage mode is the most consequential technical decision in a Power BI model, and the wrong choice shows up later as slow reports, stale data or capacity bills nobody expected. Here is how the three modes actually compare.
| Criteria | Import | DirectQuery | Direct Lake |
|---|---|---|---|
| How It Works | Data copied into the model and compressed in memory | Every visual queries the source live | Reads Delta tables in OneLake directly, no copy, no refresh |
| Performance | Fastest for most workloads | As fast as the source database allows, which often means not very | Near-Import speed on large models |
| Data Freshness | As fresh as the last refresh | Live | As fresh as the lakehouse, typically minutes |
| Scale Limits | Model size bound by memory and refresh windows | Source system becomes the bottleneck | Built for large Fabric estates |
| Needs | Any licensing tier | A source that can take the query load | Fabric capacity and OneLake |
| Choose It When | Most models, most of the time | Regulatory freshness or data that must not be copied | Large models on a Fabric platform |
Import remains the right default for most models, DirectQuery earns its place where freshness is regulatory rather than aesthetic, and Direct Lake is the reason large estates move to Fabric. We benchmark with your data before committing, because the honest answer varies by model, and mixed estates are perfectly normal.
Explore how we have helped organisations unlock insights and drive confident decisions with Power BI.
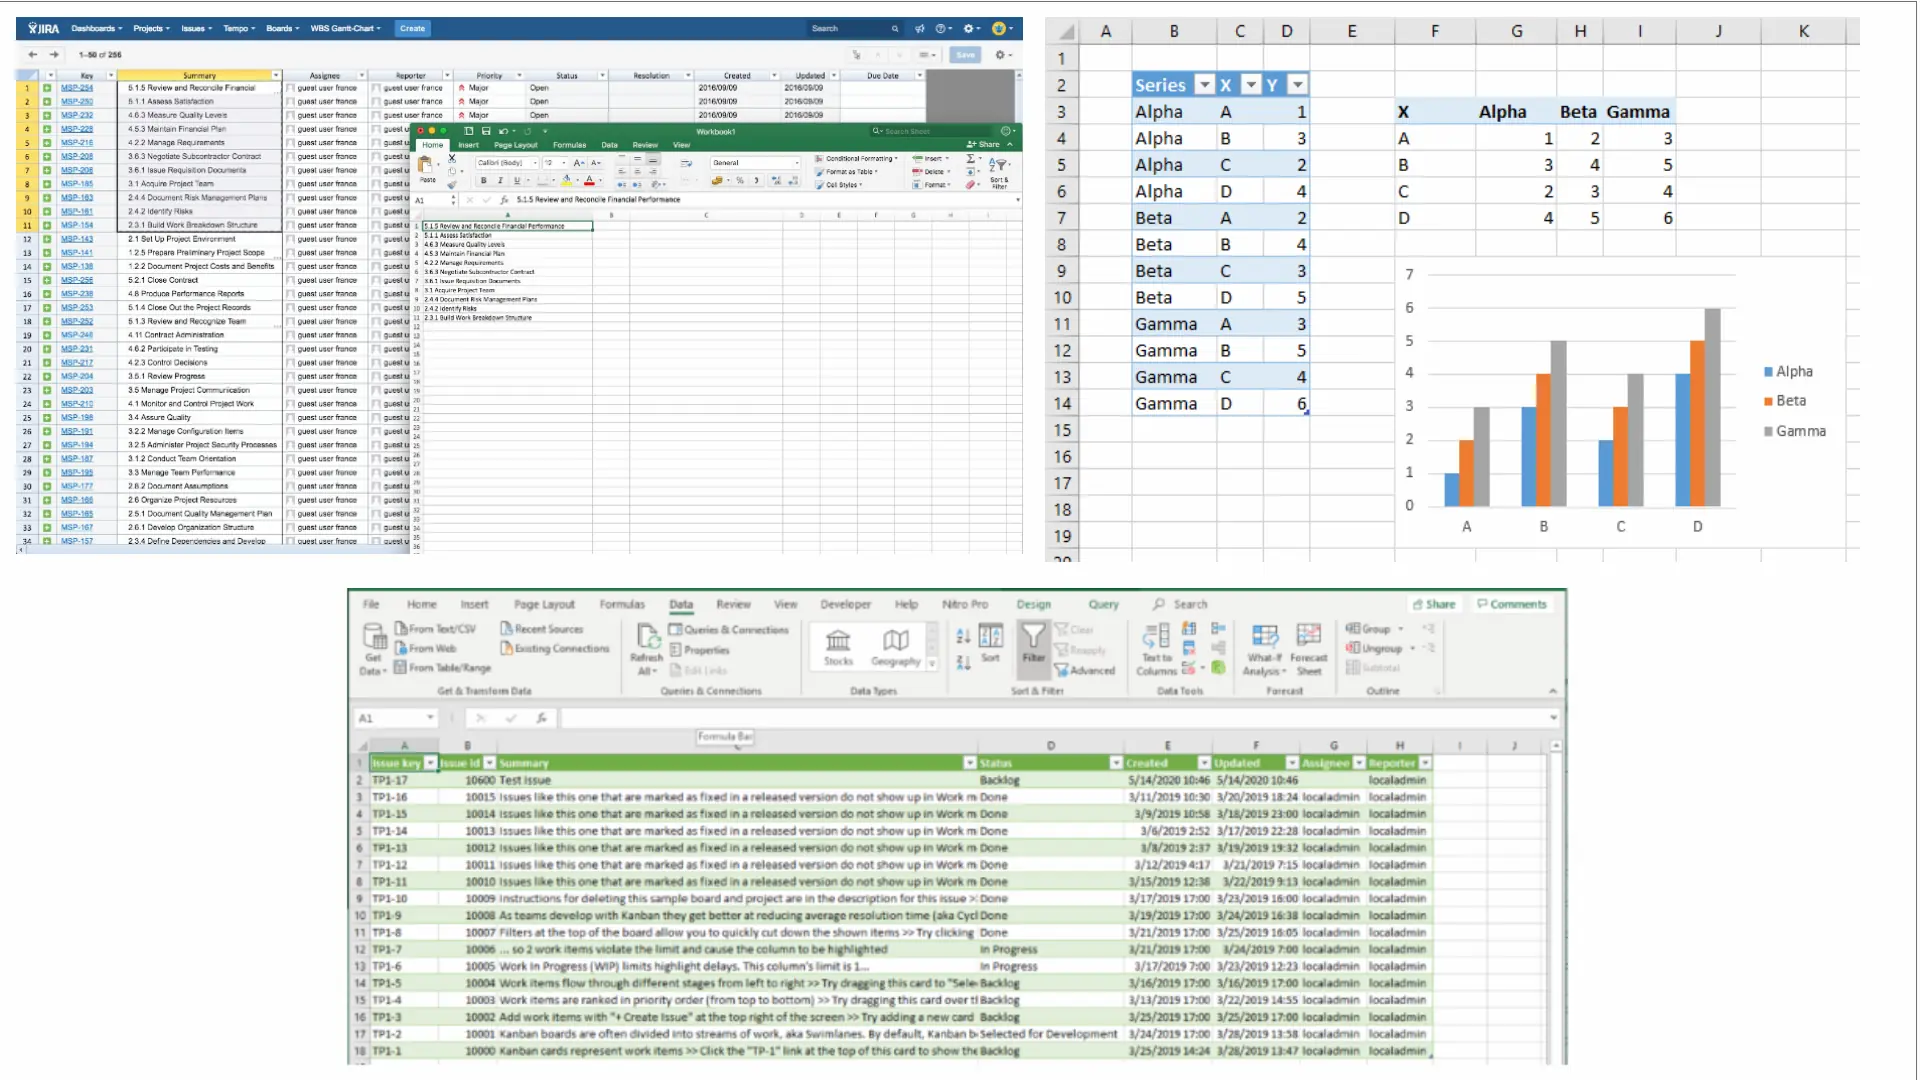
A Power BI reporting suite connected to Jira Service Management, providing real-time visibility into ticket volumes, SLA compliance, and team performance.
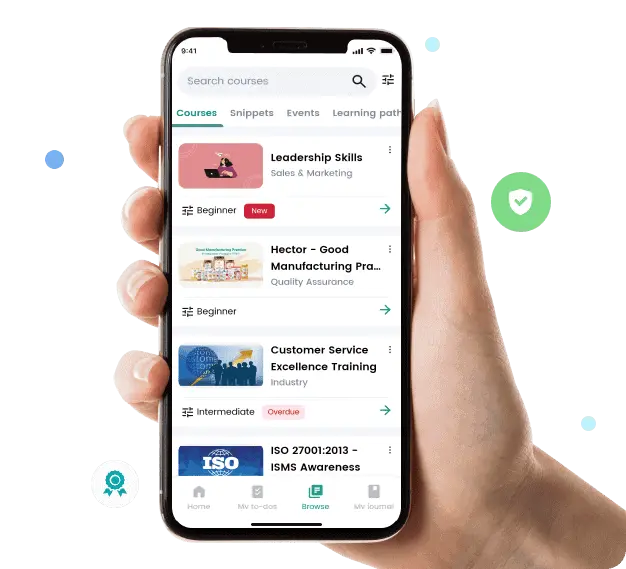
A company-wide social learning hub built as an enterprise Canvas Power App, enhanced with AI-assisted publishing, Viva Engage integration and Power BI reporting, supporting around 9,000 employees.
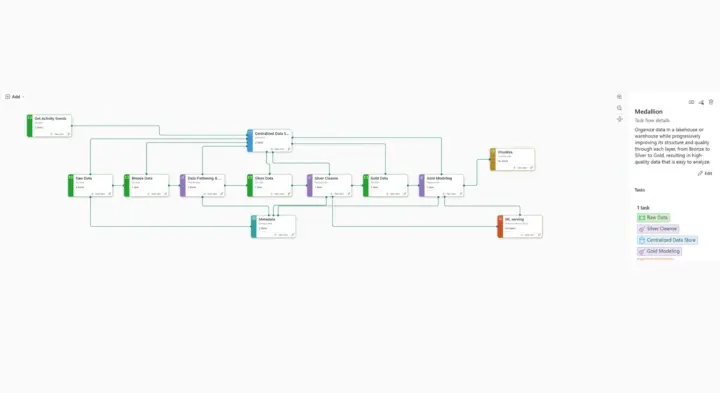
A modern Microsoft Fabric data platform with master data management, daily snapshotting and Activator alerting, built as a foundation for AI at Mount Anvil.
"Our go-to data partner. We recommend them to every one of our clients."
"We work with Synapx as our go-to and trusted partner for anything Power BI, or data in general, so much so we recommend them to all our clients! The team at Synapx work with us in a way that makes it feel like they are part of our business, our 'data team'; projects and on-going support are executed easily and effortlessly."
Chief Technology Officer, Lanware
For most enterprise clients we now recommend Fabric capacities, which include Power BI Premium features and unlock Direct Lake over OneLake. PPU remains useful for individual power users. We run a short licensing review as part of every Power BI engagement.
A first certified semantic model with a suite of dashboards typically ships in 6–10 weeks. Larger estate migrations from Tableau, Cognos or SSRS usually run 3–6 months, often in parallel with a Fabric platform build.
Both, but our sweet spot is building the governed foundation – semantic models, workspaces, ALM, adoption – on which the business can then produce many reports safely. We are happy to deliver point reports where that is genuinely what is needed.
We certify semantic models, add clear measure descriptions, synonyms and formatting, tidy relationships and apply RLS, and standardise terminology. Copilot quality is directly proportional to model quality, so the work pays off immediately.
Yes. We run structured migrations from Tableau, Cognos, Qlik, SSRS and legacy SSAS onto Power BI / Fabric, rationalising reports and rebuilding models rather than doing a 1:1 copy that preserves old problems.
Yes. Synapx As A Service provides ongoing Power BI operations – capacity optimisation, dataset refresh management, workspace governance, model enhancement and user support.







Start with a Dashboard in a Day workshop, or book a reporting health check: we review your models, refresh times, security and licensing, then tell you what to fix first.
Book a Reporting Health Check