Power BI Reporting & Power Apps AVC Calculator
The client approached Synapx to provide Power Platform support under a time-and-materials engagement. The project aimed to enhance data analytics and streamline business processes through Power BI implementation and creation of an AV Calculator from Excel to Power Apps, using Agile methodology.
Case Study70%
reduction in report generation time.
80%
reduction in the number of manual steps for AV calculations.
50%
increase of number of active users on Power BI and Power Apps within 3 months.
60%
reduction in annual operational costs through automation and enhanced analytics each year.

The Challenge
Eclipse Power faced significant challenges that hindered its ability to accurately assess business performance. The organisation operated with fragmented reporting systems, which limited visibility across departments and made it difficult to consolidate data for meaningful insights. This lack of integration slowed decision-making and reduced agility in responding to market changes. Additionally, the company relied heavily on manual processes and Excel-based tools for reporting and analysis. While Excel is flexible, it is not designed for large-scale, enterprise-level data management. Manual data entry and reconciliation across multiple spreadsheets consumed substantial time and effort, often requiring repeated checks to ensure accuracy. These processes introduced inefficiencies, increased the risk of human error, and made it challenging to maintain data consistency. Furthermore, as the volume of data grew, spreadsheets became harder to manage, leading to delays in generating reports and limiting the organisation’s ability to scale operations effectively. There was a clear need for a scalable, integrated solution aligned with organisational standards to improve efficiency, enhance data accuracy, and support future growth.
Our Solution
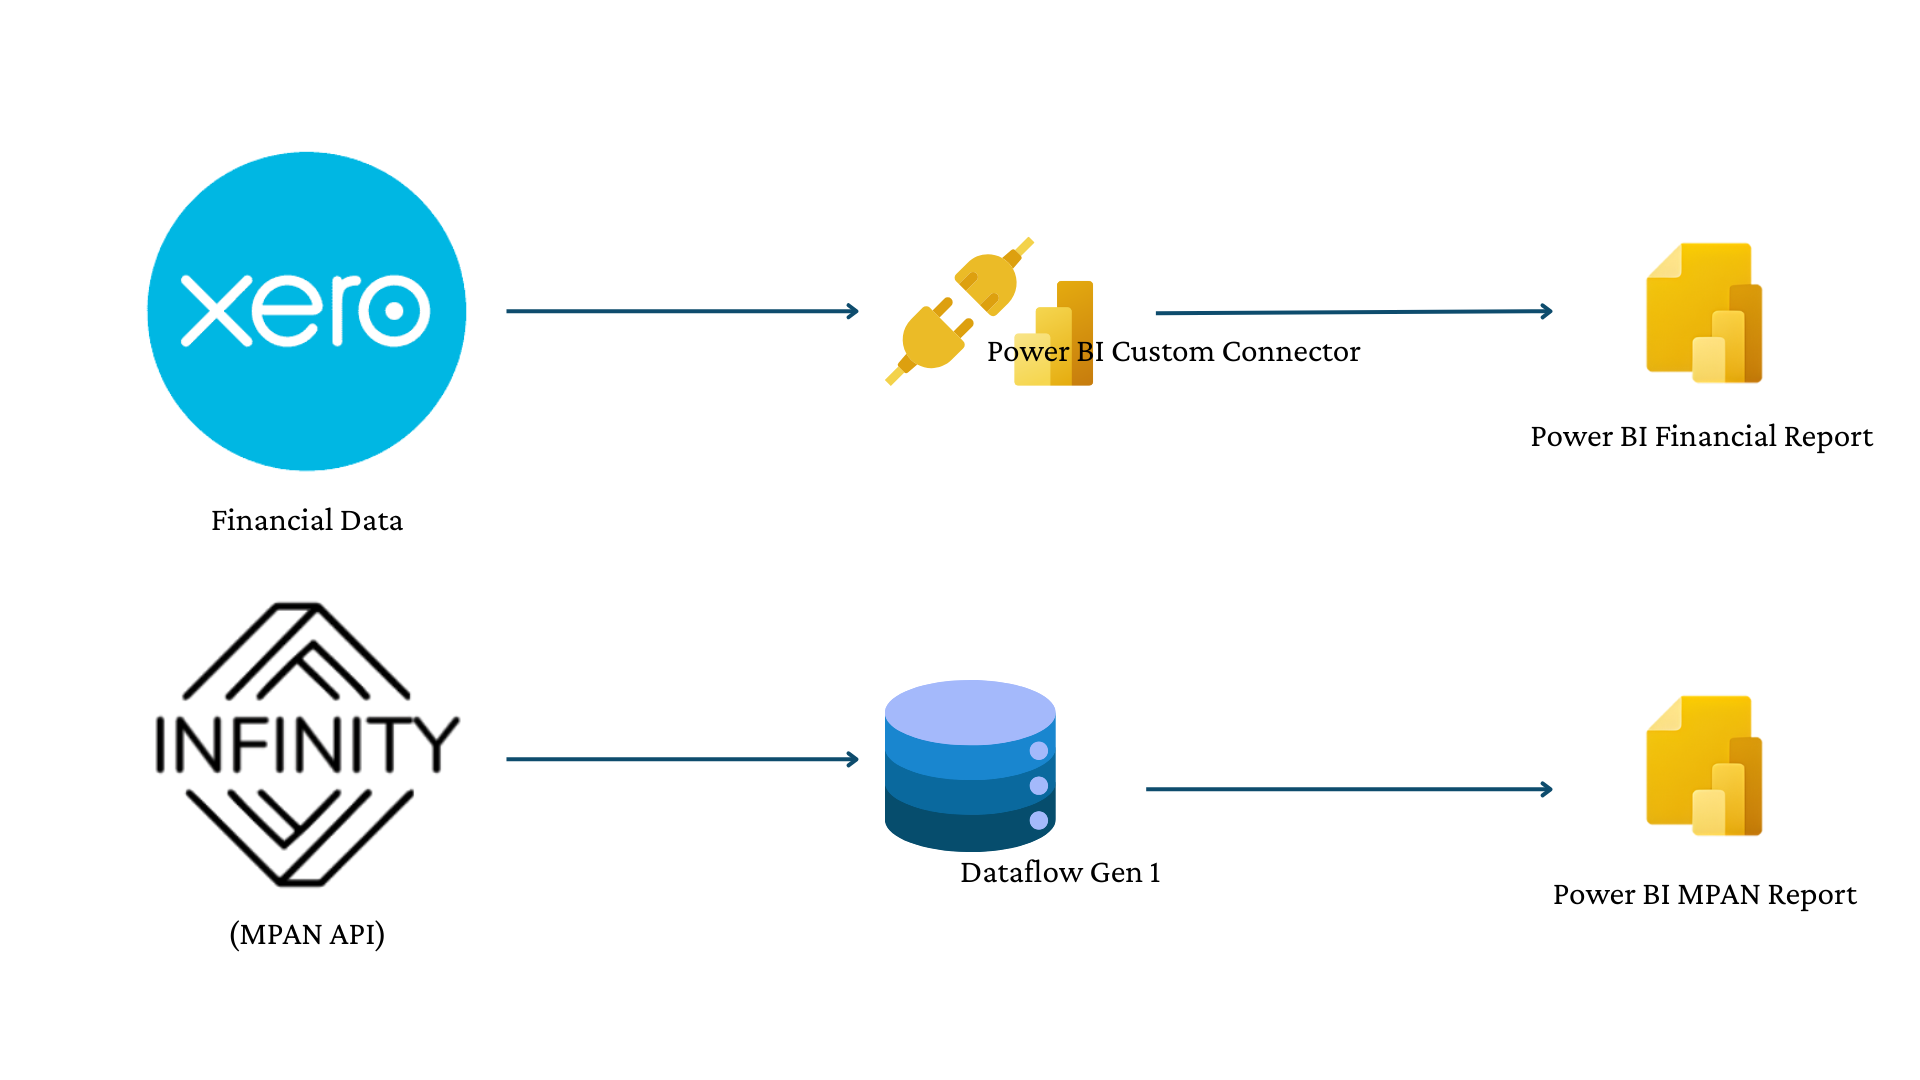
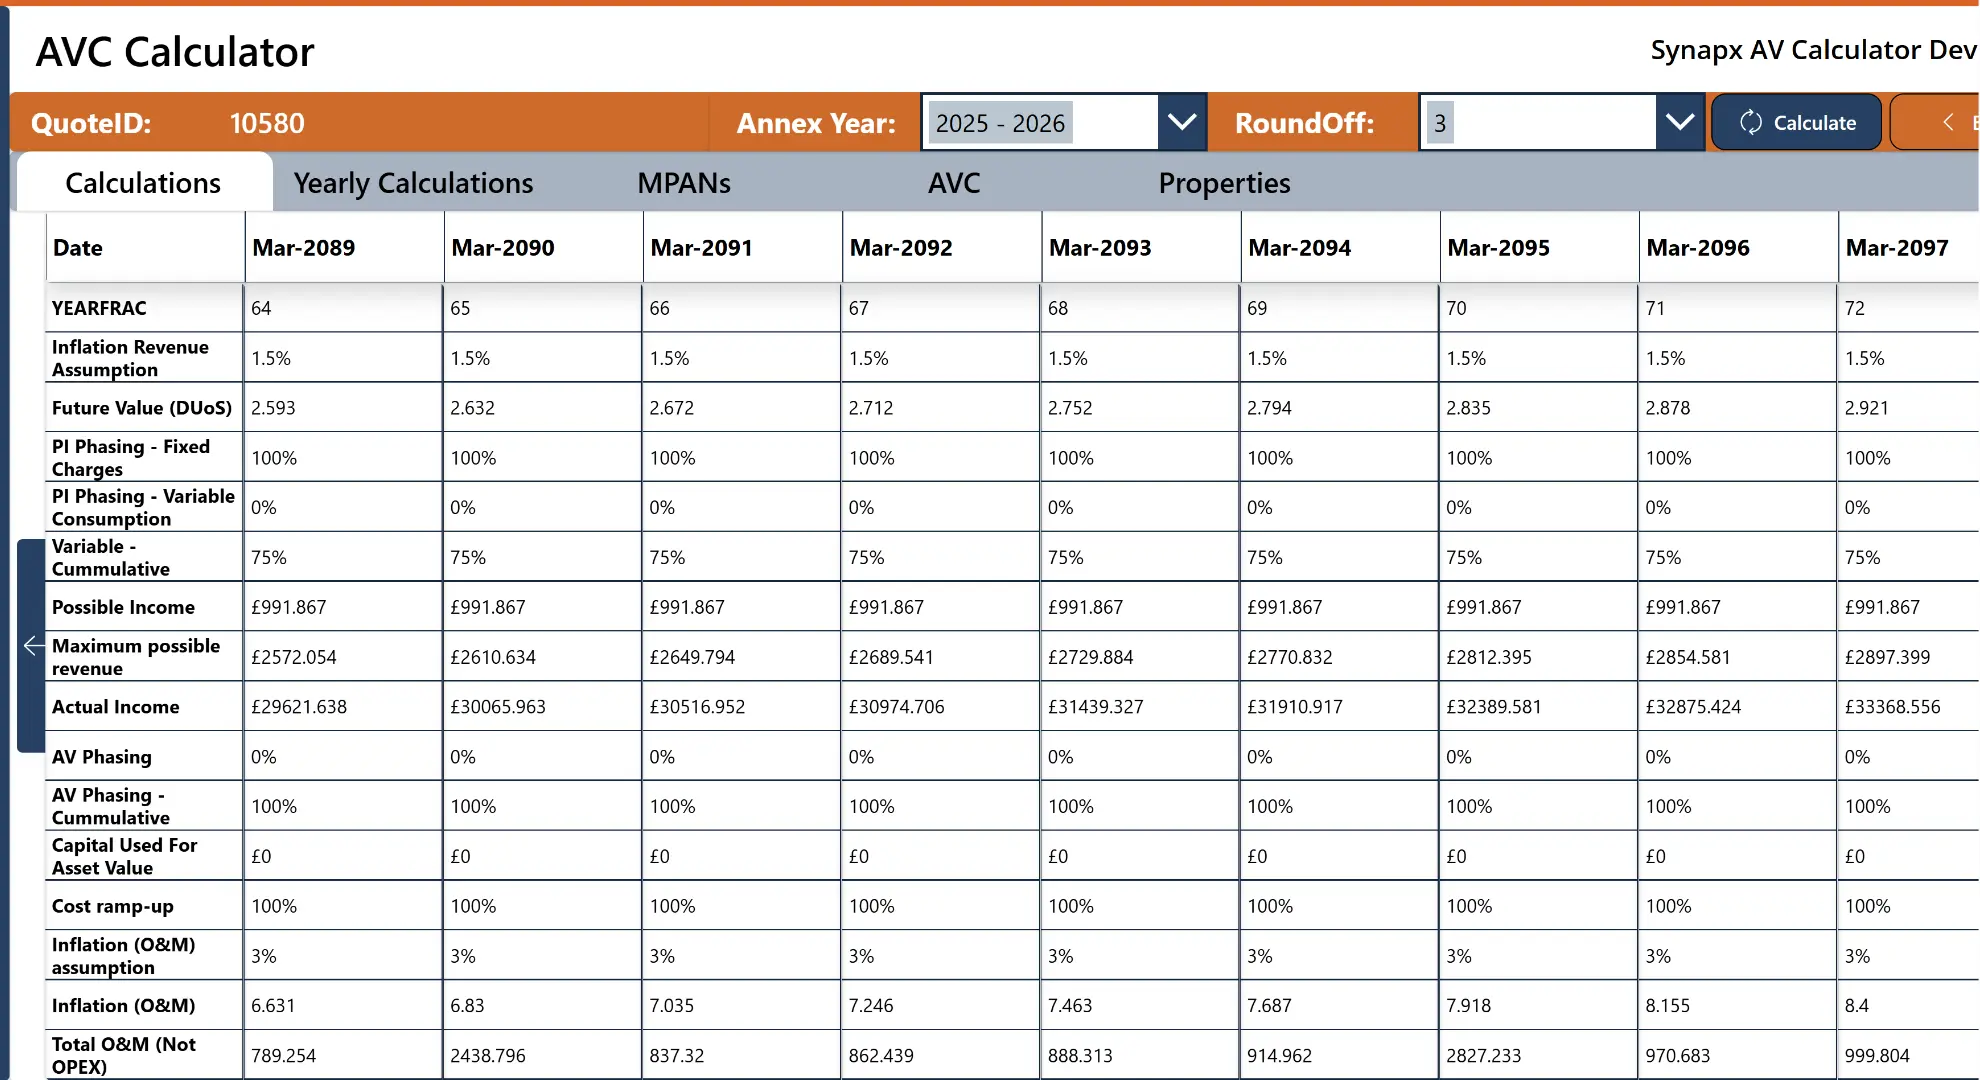
Synapx completed several key initiatives, beginning with the implementation of Power BI to address the organisation’s need for improved data visibility and actionable insights. Previously, reporting was fragmented and heavily dependent on manual processes, which made it difficult to consolidate data and derive meaningful analytics. Power BI was introduced to centralise reporting, enable real-time dashboards, and provide interactive visualisations that support faster, data-driven decision-making. To ensure successful adoption, the team conducted workshops to identify reporting requirements, established secure data connectivity, and implemented prioritised dashboards tailored to business needs. Additionally, they developed a robust Power Apps solution by converting the AVC Calculator, significantly reducing manual intervention and improving accuracy. To enhance the delivery process, Agile Scrum methodology was adopted, featuring iterative delivery through sprint planning, daily stand-ups, reviews, and retrospectives. Throughout this project, a dedicated Project Manager was assigned, along with a team of skilled Power Platform resources, including a Solution Architect, Consultants, and Analysts.
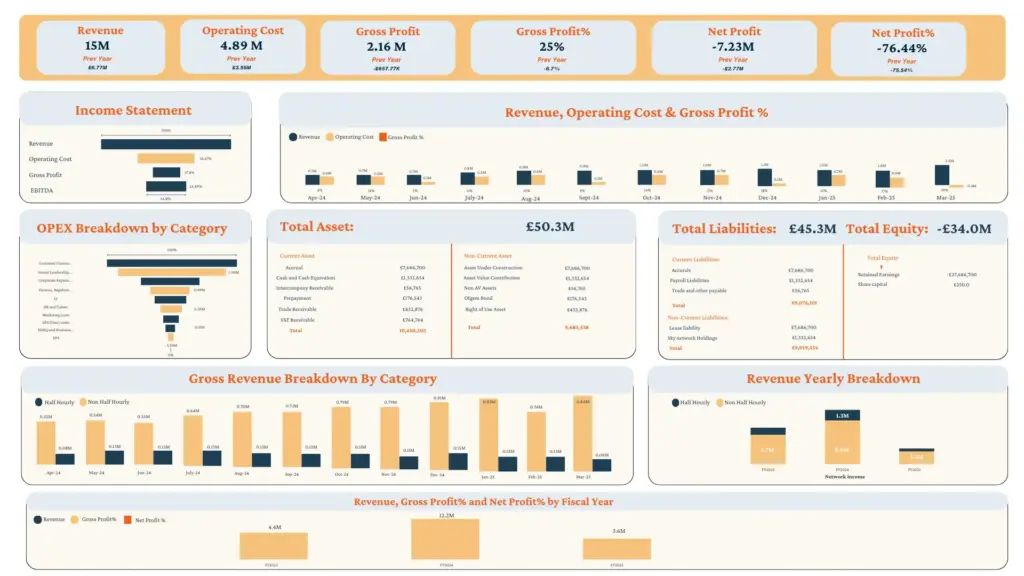
The Result
Before vs After
Other Case Studies
At Synapx, we’re proud to show how our solutions have transformed the way our clients work and operate. Below you can see our latest client project.
Dynamics 365 Automation: How Midwich Reduced Manual Work Across Order Processing, Procurement, and Pricing
The client approached us to solve the operational strain left by a complex Dynamics 365 ERP rollout, with a focus on reducing manual effort and creating a more practical path to...

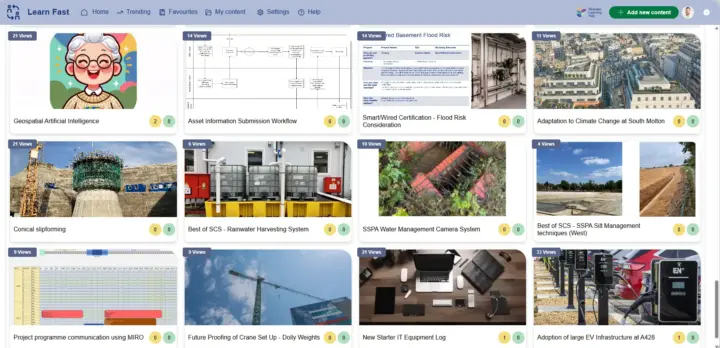
Learn Fast - Share Knowledge, Scale Adoption
Centralised Subscriber Data Integration with Power Automate
The client approached Synapx for support with the Power Platform through a time-and-materials engagement. The project focused on centralising subscriber data management and streamlining processes. This involved integrating three distinct mailing list forms into a unified database to enable efficient...

Migrating Power BI to Fabric Lakehouse with Medallion Architecture
The client approached us to automate their material transfer processes between internal and external sites. The project aimed to centralise operations and improve efficiency by replacing their manual methods with an automated system for real-time tracking. We delivered the solution...

Power BI Reporting & Power Apps AVC Calculator
The client approached Synapx to provide Power Platform support under a time-and-materials engagement. The project aimed to enhance data analytics and streamline business processes through Power BI implementation and creation of an AV Calculator from Excel to Power Apps,...

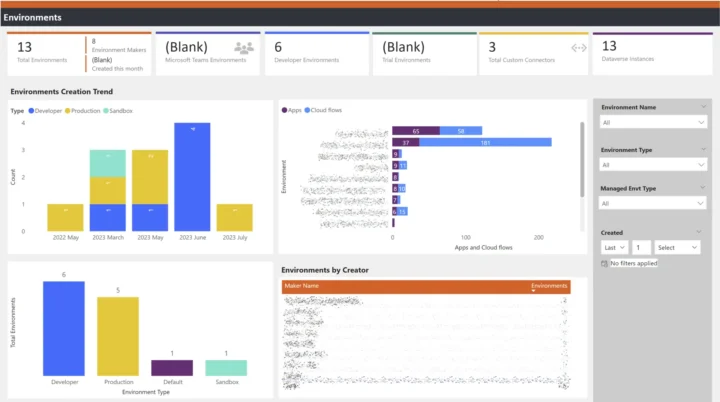
Power Platform Center of Excellence Implementation - Power BI
The client approached us in order to implement a reporting system to provide oversight on the implementation of power-platform within their organisation.
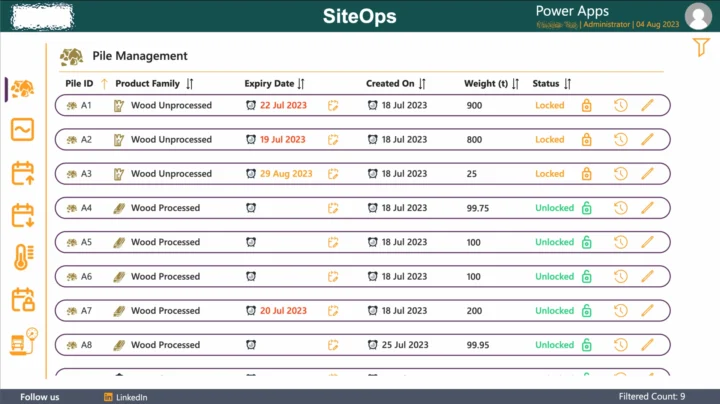
Material Management Application with Business Central Automation - Power Apps with Power Automate
The client approached us needing a system to automate their processes for managing the transfer of different materials held in piles between their internal and external sites.
Policies and Procedures - Power Apps with SharePoint Documents Library
The client wanted an application to effectively manage their companies policies and procedures from within a SharePoint documents library.

Personnel Directory - Power Apps
The client wanted a directory within their SharePoint site to display all their staff members, and provided key contact details such as their phone number and email address.

Book A Free Discovery Session
Schedule a FREE call with our power platform specialists.
Book a Discovery Session