

Power BI is Microsoft’s business intelligence platform. It turns raw data from spreadsheets, databases, cloud services, and enterprise systems into interactive dashboards and reports that people across an organisation can use to make better decisions.
That is the marketing version. The honest version is that Power BI is excellent for some things, overkill for others, and genuinely the wrong tool for a few specific scenarios. This guide tells you all three, so you can decide whether it belongs in your organisation
What Power BI Actually Does
Power BI has three distinct jobs, and understanding all three is important because most introductions only describe one.
1. It connects to your data
Power BI can connect to over 1,100 data sources: Excel files, SQL Server databases, Azure data services, SharePoint lists, Dynamics 365, Salesforce, SAP, Google Analytics, Snowflake, and hundreds more. The connecting and transforming of data happens in Power Query — a visual tool that is genuinely powerful once you know it, but has a meaningful learning curve.
2. It models relationships between data
Raw data is rarely in the shape you need for reporting. Power BI’s data model lets you define relationships between tables, create calculated columns and measures using a formula language called DAX, and build a semantic layer that non-technical users can query without understanding the underlying database structure. This is where Power BI earns its enterprise credentials, but it is also where it requires real expertise to use correctly.
3. It visualises and distributes insights
Once the data is connected and modelled, Power BI creates interactive reports and dashboards that can be accessed through a browser, the Power BI mobile app, embedded in other applications, or published to Microsoft Teams. In 2026, this layer includes Copilot, allowing users to ask questions in plain language and generate new visuals without building them manually.

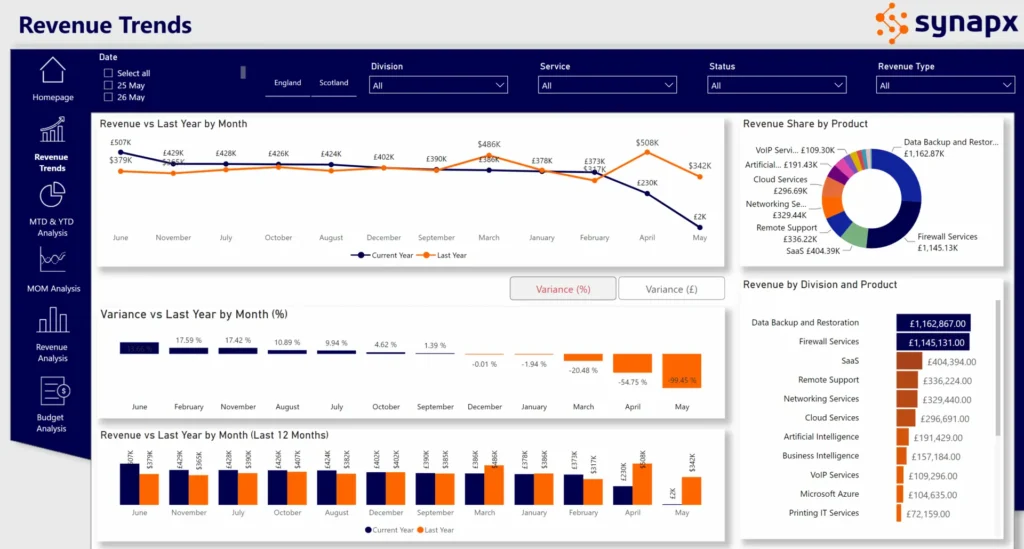
What Power BI Looks Like in Practice
Rather than abstract descriptions, here is what organisations actually build with Power BI:
- Financial reporting: monthly P&L dashboards connected live to Dynamics 365, showing actuals vs budget by cost centre, with automatic alerts when key metrics breach thresholds
- Operational dashboards: real-time site performance reporting for a construction company, pulling from project management systems, safety databases, and procurement tools
- Sales analytics: pipeline, conversion, and revenue reporting for a sales team, combining CRM data with marketing attribution and finance actuals
- Supply chain visibility: inventory levels, supplier performance, and demand forecasting across multiple distribution centres, updated daily
- HR reporting: headcount, attrition, recruitment pipeline, and training completion tracking across departments
In every case, Power BI is doing the same thing: taking data that exists in operational systems, shaping it into something meaningful, and making it accessible to decision-makers without requiring them to write queries or export spreadsheets.
Key benefits of data visualisation using Power BI:
Data visualisation with Power BI offers numerous benefits for businesses, enhancing decision-making, reporting, and overall data management.
1. Enhanced Understanding of Data – Power BI converts complex datasets into easy-to-understand visual formats, making it easier for stakeholders to grasp intricate details and insights without needing deep expertise in data analysis. Visualisations help in identifying trends, outliers, and patterns in data that might not be apparent from raw numbers.
2. Improved Decision Making – By providing visual insights, Power BI enables businesses to make decisions based on data rather than intuition. With real-time data visualisation capabilities, businesses can make timely decisions based on the most current data. This allows businesses to stay competitive, quickly adapting to market changes and customer needs.
5. Monitoring and Tracking Key Performance Indicators (KPIs) – Businesses can set up dashboards to monitor KPIs, ensuring that critical metrics are always in sight and up-to-date. Power BI can be configured to send alerts when certain metrics reach predefined thresholds, enabling prompt responses to changes.
6. Customisation and Flexibility – Power BI offers a range of customisation options, allowing businesses to tailor reports and dashboards to their specific needs. It can handle large volumes of data and grow with the business, accommodating increasing data analysis needs.
Power BI in 2026: The Copilot Difference
Power BI has changed significantly in the past 12 months. The most important development is the maturation of Copilot, Microsoft’s AI layer embedded directly into Power BI reports and dashboards.
In 2026, Power BI Copilot can:
- Generate a new report page from a plain-language description: ‘create a sales performance summary by region and product line for last quarter’
- Write DAX formulas automatically based on a description of what you want to calculate
- Summarise a dashboard in plain language and explain what the data is showing
- Answer data questions conversationally, ‘why did revenue drop in March?’, against your actual data model
This is not a gimmick. For organisations with large analyst populations who spend significant time answering ad hoc data questions, the productivity impact is material. The caveat is that Copilot requires a Fabric capacity subscription (F64 recommended for full capability) – it is not available on standard Power BI Pro alone.
Power BI Pricing in 2026
| Version | Cost | Who it’s for | Sharing |
| Power BI Desktop | Free | Individual analysis, local use only | No sharing — local only |
| Power BI Pro | ~$14/user/month | Teams sharing reports and dashboards | Share with other Pro users |
| Premium Per User (PPU) | ~$24/user/month | Advanced features, larger datasets | Share with any user |
| Fabric F SKUs (F2–F256) | ~£200–£25,600/month | Enterprise, team-wide or org-wide sharing | All users at F64+ — no per-user licences |
The pricing model changed significantly in 2025 when Power BI Premium capacity (P SKUs) was retired and replaced by Microsoft Fabric capacity. For most enterprise deployments, the relevant decision is now between Pro licences (per user) and Fabric capacity (per capacity).
Integration with Other Microsoft Services
Power BI’s integration with other Microsoft services allows for seamless and enhanced data analytics experiences within the Microsoft ecosystem. This integration is designed to leverage the interconnectedness of various Microsoft tools and platforms, facilitating efficient data flow and analysis.
Examples
- Azure Services: Such as Azure SQL Database, Azure Data Lake, Azure Blob Storage.
- Microsoft 365 Applications: Including Excel, SharePoint Online, and Microsoft Teams.
- Microsoft Dynamics 365: For CRM and ERP data analytics.
Benefits for Organisations
- Streamlined Workflow: Smooth integration with familiar Microsoft tools enhances workflow efficiency.
- Unified Data Ecosystem: Easy consolidation of data from various Microsoft services into Power BI for comprehensive analytics.
- Consistency and Compatibility: Ensures data consistency and compatibility, reducing integration challenges.
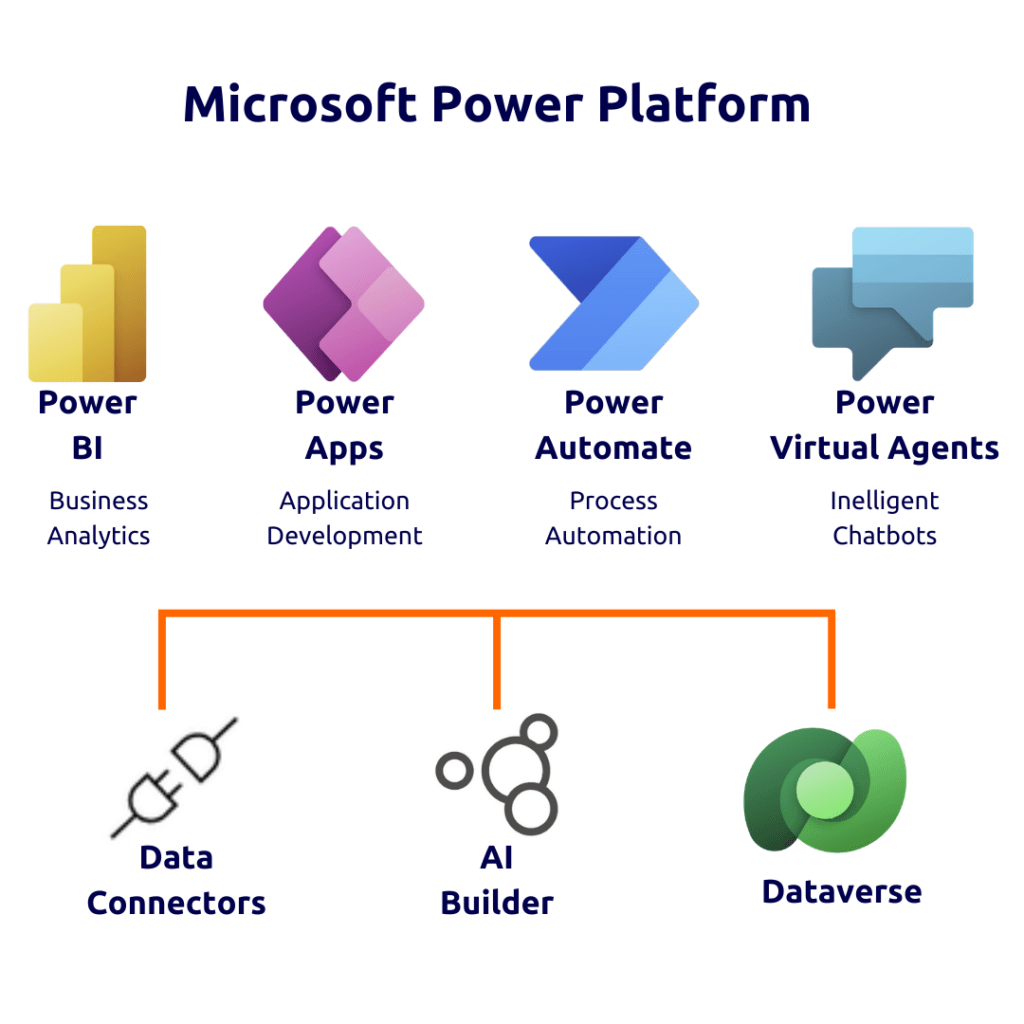
Integration with the Power Platform
The integration of Power BI with other components of the Microsoft Power Platform (Power Apps, Power Automate, and Copilot Studio) creates a robust ecosystem for business process automation, app development, and data analytics. Integration with Copilot Studio: Use data insights from Power BI to power conversational AI experiences, enabling chatbots and AI assistants to respond intelligently based on real-time business data.
Examples
- Power Apps: Embedding Power BI visualisations in custom apps created with Power Apps.
- Power Automate: Triggering workflows in Power Automate based on insights derived from Power BI.
- Integration with Copilot Studio: Use data insights from Power BI to power conversational AI experiences, enabling chatbots and AI assistants to respond intelligently based on real-time business data.
Power BI now integrates seamlessly with Microsoft Fabric, OneLake, and other Microsoft 365 tools, creating a single, governed analytics environment. This allows users to connect live to shared data sources across SharePoint, Azure, and the Power Platform through OneLake Shortcuts, including cross-domain linking.
Benefits for Organisations
- Enhanced Automation and Efficiency: Integration enables automated actions and streamlined processes across the platform.
- Comprehensive Solutions: Allows businesses to develop comprehensive solutions combining analytics, automation, and custom app development.
- Agility and Responsiveness: Improves business agility by enabling quick responses to data-driven insights.
APIs that Already Exist within Power BI Framework
Power BI provides a set of APIs that enable integration with various external services and applications. These APIs allow developers to extend the functionality of Power BI, integrate it with other software, and automate aspects of BI workflows.
Examples
- Data Connectivity APIs: For connecting to different data sources.
- Embedding API: To embed Power BI reports and dashboards into other applications.
- Automation API: For automating tasks like report generation and dataset management.
Benefits for Organisations
- Custom Integration: Enables tailored integrations with external systems, providing flexibility.
- Extended Functionality: Allows for extending the capabilities of Power BI beyond its standard offerings.
- Automation and Efficiency: APIs can be used to automate repetitive tasks, enhancing operational efficiency.
Customisable Connectors
Power BI’s customisable connectors allow organisations to connect to data sources that are not supported by default. These connectors can be tailored to specific data sources or APIs, enabling businesses to access and analyse data from a wide range of systems.
Examples
- Custom Database Connectors: For unique or proprietary databases.
- Web API Connectors: To connect with custom-built APIs or services.
- Third-Party Service Connectors: Tailored connectors for specific third-party services not covered by default connectors.
Benefits for Organisations
- Data Accessibility: Facilitates access to a broader range of data sources, enhancing data-driven decision-making.
- Tailored Data Solutions: Custom connectors can be specifically designed to meet unique business requirements.
- Versatility and Reach: Expands the versatility of Power BI by enabling connections to niche or specialised data sources.
Each of these integration categories enhances Power BI’s capability to serve as a comprehensive business intelligence tool, providing organisations with the flexibility, efficiency, and comprehensiveness needed to leverage their data assets effectively.
What Power BI Can Be Used For
Power BI is widely used for a range of business intelligence and data analysis tasks. This versatile platform is adept at transforming raw data into meaningful insights through its comprehensive data visualisation and real-time analytics capabilities. Used across diverse fields such as finance, marketing, sales, and operations, Power BI enables organisations to understand complex datasets, identify trends, and make informed strategic decisions. Here are some use-cases for Power BI:
Sales and Revenue Analysis
Tracking Sales Performance: Companies use Power BI to monitor sales metrics, compare performance across different regions, products, or sales teams, and identify trends or issues in the sales process.
Revenue Forecasting: Analysing historical sales data to forecast future revenues, helping in budgeting and financial planning.
Financial Reporting and Analysis
Financial Dashboard Creation: Creating dashboards for real-time financial monitoring, including profit and loss statements, balance sheets, and cash flow analysis.
Budgeting and Expense Tracking: Comparing actual expenses against budgeted amounts and analysing variances to manage costs effectively.
Customer Analytics
Customer Segmentation: Analysing customer data to segment them into groups based on purchasing behaviour, preferences, or demographics.
Tracking Customer Satisfaction: Using survey data to track and improve customer satisfaction and loyalty.
Supply Chain and Inventory Management
Inventory Optimisation: Monitoring inventory levels, identifying trends in inventory turnover, and optimising stock levels to reduce costs and improve efficiency.
Supply Chain Analysis: Analysing supply chain operations to identify bottlenecks or opportunities for cost savings and efficiency improvements.
Human Resources (HR) Analytics
Employee Performance Monitoring: Tracking employee performance metrics, identifying high performers, and analysing workforce composition.
HR Dashboard: Creating dashboards to monitor HR metrics like employee turnover, recruitment metrics, and employee satisfaction.
Marketing Analytics
Campaign Performance Analysis: Measuring the effectiveness of marketing campaigns, analysing return on investment (ROI), and understanding customer engagement across different channels.
Market Trends Analysis: Identifying trends in the market and customer behaviour to inform marketing strategies.
Operations Management
Operational Efficiency Tracking: Monitoring operational metrics to identify inefficiencies and areas for improvement in business processes.
Resource Utilisation Analysis: Analysing the utilisation of resources in operations to optimise usage and reduce waste.
Project Management
Project Tracking: Creating dashboards to track project progress, budget utilisation, and timelines, helping project managers stay on top of multiple projects.
Healthcare Analytics
Patient Data Analysis: Analysing patient data for better healthcare delivery, understanding patient demographics, and treatment outcomes.
Resource Allocation: Optimising the allocation of healthcare resources, including staff and medical equipment.
Retail Analytics
Sales Trend Analysis: Analysing sales data to understand consumer buying patterns, seasonal trends, and product performance.
Store Performance Analysis: Comparing performance across different store locations and optimising inventory and staffing based on store-specific trends.
Choosing The Right Power BI Service For Your Business
Microsoft Power BI offers several services, each tailored to different user needs and organisational requirements. Power BI Service now operates as part of Microsoft Fabric, providing a unified experience for analytics, data engineering, and governance. It includes Copilot in Power BI, enabling users to describe visuals, build reports, and generate insights using natural language directly within the service.
Power BI Desktop
Power BI Desktop is a free application provided by Microsoft as part of its Power BI suite of business analytics tools. It’s designed for individual use and serves as the primary tool for creating business intelligence reports and data visualisations.
Key Features of Power BI Desktop
- Data Connectivity: Power BI Desktop allows users to connect to a wide variety of data sources, including databases, Excel files, cloud services, and more. It can import and transform data from these sources for analysis.
- Data Transformation and Modelling: It includes powerful data transformation and modelling capabilities, enabling users to clean, reshape, and combine data in a user-friendly way. This is done using Power Query, which is integrated into Power BI Desktop.
- Creating Visualisations: Users can create a range of visualisations like charts, graphs, maps, and tables to represent data. The drag-and-drop interface makes it easy to design reports and dashboards.
- Advanced Analytics: Power BI Desktop supports advanced analytics features, including calculated columns, measures using DAX (Data Analysis Expressions), and the integration of machine learning models.
- Customisation: It offers extensive customisation options for reports, including the ability to define the layout, colours, and other visual elements to make the reports more informative and appealing.
- Publishing Reports: Once the reports are created, they can be published to the Power BI Service for sharing and collaboration with others in the organisation.
Benefits of Power BI Desktop
- No Cost: Power BI Desktop is free to download and use, making it an accessible option for individuals and businesses starting with BI.
- Integration with Power BI Service: It works seamlessly with Power BI Service, allowing users to publish reports to the cloud for broader access and collaboration.
- User-Friendly Interface: Its interface is intuitive, making it easier for beginners to start creating reports and visualisations without a steep learning curve.
- Powerful Data Processing: Despite being a free tool, it offers robust data processing and analytics capabilities.
Considerations
- Local Processing: Unlike Power BI Service, which is cloud-based, Power BI Desktop processes data locally on the user’s computer.
- No Collaboration Features: It does not include real-time collaboration features. For collaboration, reports need to be published to Power BI Service.
Power BI Service
Power BI Service, also known as Power BI Online, is a cloud-based service in the Power BI suite offered by Microsoft. It enables users to share, collaborate on, and publish business intelligence reports and dashboards created in Power BI Desktop. This service is designed for both individual and organisational use, facilitating real-time data analysis, reporting, and decision-making.
Key Features of Power BI Service
- Sharing and Collaboration: Power BI Service enables users to share their reports and dashboards with colleagues within their organisation. This sharing can be done via direct links, email, or by embedding reports in websites or apps.
- App Workspaces: App workspaces in Power BI Service are collaborative environments where teams can work together on BI projects. Each workspace allows for the creation, sharing, and editing of dashboards and reports among a group of users.
- Content Packs and Apps: Users can create content packs and apps that package together related reports, dashboards, and datasets. These can be published and shared with other users in the organisation.
- Real-Time Dashboards: Power BI Service supports real-time dashboards, which update instantly as the underlying data changes. This is particularly useful for monitoring live data streams, like website traffic or live sales data.
- Scheduled Data Refresh: The service allows for the scheduling of data refreshes, which automatically update the data in reports and dashboards at set intervals.
Benefits of Power BI Service
- Collaborative BI Environment: Power BI Service fosters a highly collaborative environment for business intelligence. It enables teams to work jointly on data analysis, report creation, and decision-making processes.
- Accessibility and Convenience: Being cloud-based, Power BI Service offers the convenience of accessing BI content from anywhere, at any time, on any device with internet access. This level of accessibility ensures that decision-makers and team members have constant access to critical business data, whether they are in the office, working remotely, or on the move.
- Centralised BI Content Management: The service provides a centralised platform for managing and distributing all business intelligence content within an organisation. Centralised management simplifies the governance of BI assets, ensures consistency in reporting, and eases the discovery and use of relevant BI content across the organisation.
Considerations
- Internet Dependency: Being cloud-based, it requires an internet connection for access.
- Subscription Cost: Unlike Power BI Desktop, Power BI Service requires a subscription (Pro or Premium)
- Power BI Pro
- Who It’s For: Professionals who need to collaborate and share insights across an organisation.
- Features: Includes all the features of Power BI Desktop, plus the ability to publish reports, share dashboards, and collaborate with other users in the organisation.
- Cost: Subscription-based, with a per-user monthly fee.
- Benefits: Enables collaboration, app creation, and sharing of interactive reports and dashboards within the organisation.
- Power BI Premium
- Who It’s For: Large enterprises requiring advanced capabilities, large-scale deployment, and dedicated cloud resources.
- Features: Includes all features of Power BI Pro, plus:
- Higher data capacity limits.
- Improved performance with dedicated cloud resources.
- Greater scalability and advanced administration features.
- Ability to publish reports and dashboards to a broader audience, including users without a Power BI license.
- Cost: Subscription-based, priced per dedicated cloud resource (not per user), making it more suitable for large numbers of users.
- Benefits: Ideal for larger organisations that need to distribute reports widely or require dedicated resources for performance and data capacity.
Power BI Premium is now delivered as part of Microsoft Fabric Capacity, offering unified compute resources for all Fabric workloads, including Power BI, Data Factory, Synapse, and Real-Time Intelligence. This provides greater flexibility, scalability, and cost efficiency than traditional Premium capacities.
- Power BI Premium Per User
- Who It’s For: Individual users needing advanced features of Power BI Premium without the scale of enterprise-level deployment.
- Features: Offers a subset of Premium features on a per-user basis, including AI and paginated reports.
- Cost: Higher subscription fee than Power BI Pro but much lower than the full Premium version.
- Benefits: Provides a middle ground for users who need more than Pro but don’t require full enterprise-level Premium capabilities.
Power BI Mobile
Power BI Mobile is a part of Microsoft’s Power BI suite, designed as a mobile application for iOS, Android, and Windows devices. It allows users to access and interact with their Power BI dashboards and reports on-the-go. The app provides a convenient way for users to view and engage with their business data, offering features like alerts and data-driven notifications.
Key Features
- Mobile-Optimised Reports: Reports and dashboards are optimised for mobile viewing.
- Alerts and Notifications: Users can receive data-driven alerts and notifications on their mobile devices.
- Offline Access: Offers some capabilities for accessing reports even when offline.
Benefits
- On-the-Go Access: Enhances decision-making by providing immediate access to BI content from anywhere.
- Real-Time Insights: Keeps users up-to-date with real-time data and alerts.
Considerations
- Mobile User Experience: While optimised, the mobile experience may differ from the desktop due to screen size limitations.
Power BI Embedded
Power BI Embedded, offered by Microsoft Azure, is a service that allows developers to embed interactive Power BI reports and dashboards into custom applications or websites. It is primarily targeted at software developers and Independent Software Vendors (ISVs) who want to integrate Power BI’s business analytics capabilities into their own products, enhancing their applications with rich data visualisations and analytics.
Key Features
- Seamless Integration: Allows for seamless integration of interactive Power BI reports in applications or websites.
- Custom User Interfaces: Developers can design custom interfaces around embedded BI content.
- API Access: Offers APIs for programmatically working with Power BI content.
Benefits
- Enhanced Application Value: Adds valuable BI features to software products, enhancing user experience and value.
- Flexible Licensing: Billed based on usage (rendering hours), which can be more cost-effective for embedded scenarios.
Considerations
- Technical Expertise: Requires developer skills to implement and manage embedded BI content.
- Dependency on Application Architecture: Integration depth can depend on the architecture and capabilities of the target application or website.
Power BI Report Server
Power BI Report Server is an on-premises server solution, part of Microsoft’s Power BI suite, that enables businesses to host and manage their Power BI reports, as well as traditional paginated reports, within their own IT infrastructure. It caters to organisations with requirements for on-premises report deployment due to data privacy, compliance, or other regulatory reasons, combining the capabilities of Power BI and SQL Server Reporting Services.
Key Features
- Report Publishing: Users can publish Power BI reports created in Power BI Desktop to the Report Server.
- Paginated Reporting: Supports traditional paginated reports, useful for operational reporting.
- Data Security: Because it’s on-premises, it offers greater control over data security and compliance.
Benefits
- Data Sovereignty: Addresses concerns about storing sensitive data in the cloud.
- Integration with SQL Server Reporting Services (SSRS): Combines Power BI and SSRS capabilities in a single platform.
Considerations
- Infrastructure Management: Requires infrastructure and IT expertise for setup and ongoing maintenance.
- Limited Cloud Features: Some cloud-based features of Power BI Service may not be available.
| Features | Power BI Desktop | Power BI Service | Power BI Report Server | Power BI Mobile | Power BI Embedded |
| Cloud-based Access | ✘ | ✔ | ✘ | ✔ | ✔ |
| Real-time Collaboration | ✘ | ✔ | ✘ | ✔ | ✘ |
| Data Refresh & Publishing | ✔ | ✔ | ✔ | ✔ | ✘ |
| Mobile Accessibility | ✘ | ✔ | ✔ | ✔ | ✘ |
| On-premises Data Hosting | ✘ | ✘ | ✔ | ✘ | ✘ |
| Embedding in Applications | ✘ | ✘ | ✘ | ✘ | ✔ |
| Paginated Reporting | ✘ | ✘ | ✔ | ✘ | ✘ |
| Integration with Power BI Desktop | ✔ | ✔ | ✔ | ✔ | ✘ |
| Offline Access | ✘ | ✘ | ✔ | ✔ | ✘ |
| API for Custom Development | ✘ | ✘ | ✘ | ✘ | ✔ |
Power BI Cost
Understanding the pricing model of Power BI can be a bit complex as it involves several components.
Power BI Desktop – Power BI Desktop is completely free. It’s a feature-rich desktop application used for creating reports and data visualisations.Ideal for individual users to create, model, and design reports.
Power BI Service – The Power BI Service (Power BI Online) offers two main subscription models:
- Power BI Pro: This is a paid subscription, typically required for each user who creates or consumes reports. It’s needed for sharing reports and collaboration.
- Power BI Premium: This provides capacity-based pricing (i.e., the cost is based on the resources used rather than per user). It’s intended for larger enterprises and offers additional features like larger data capacities and improved performance. There is a sub-service also available for this: Power BI Premium Per User which is for Individual users needing advanced features of Power BI Premium without the scale of enterprise-level deployment.
Power BI Mobile – The Power BI Mobile app is free to download and use. However, to access certain reports and features within the app, you might need a Power BI Pro or Premium subscription.
Power BI Embedded – Power BI Embedded is billed through Azure and is separate from the Pro and Premium subscriptions. It’s used to embed reports and dashboards in applications and is priced based on the number of render hours.
Power BI Report Server – Part of Premium Subscription: Power BI Report Server is available as part of the Power BI Premium subscription. Alternatively, it’s also available with SQL Server Enterprise Edition with Software Assurance.
What’s New?
- Powered by Microsoft Fabric for unified data management and analytics.
- Copilot in Power BI for natural language report creation.
- Direct Lake Mode as the new default for real-time data analysis.
- OneLake Shortcuts for seamless cross-domain data connectivity.
- Over 1,100 connectors now available across cloud and on-premises sources.
- Mirroring and Real-Time Intelligence for live database and IoT analytics.
- Power Virtual Agents rebranded as Copilot Studio, integrated for conversational insights.
- Enhanced governance and security via the Power Platform Admin Center.
Who Power BI Is Right For
- Organisations already using Microsoft 365, Azure, or Dynamics – Power BI integrates natively, and the total cost of ownership is very competitive
- Finance, operations, and leadership teams that need reliable, governed reporting across multiple data sources
- Organisations wanting self-service analytics for non-technical users – Power BI’s interface is more accessible than most competing tools
- Teams that want to move from Excel-based reporting to something that updates automatically, handles larger datasets, and is accessible to more people
Who Power BI Is Not Right For
- Organisations whose primary need is exploratory data analysis by expert data scientists, tools like Databricks or Python-based notebooks may be more appropriate
- Organisations deeply invested in Salesforce seeking tight CRM-BI integration, Tableau’s native Salesforce integration is a genuine advantage in that context
- Teams with simple dashboard needs and tiny budgets, Power BI is excellent, but if you have one data source, 5 users, and need 3 simple charts, lighter tools may suffice
How Power BI Sits Within Microsoft Fabric
Power BI in 2026 is not a standalone product; it is the business intelligence and reporting layer within Microsoft Fabric. Fabric is Microsoft’s unified data platform that brings together data engineering, data science, warehousing, real-time analytics, and Power BI under one platform with shared storage (OneLake) and shared governance (Microsoft Purview).
For organisations evaluating Power BI, this matters because the investment is not in a BI tool alone; it is in a data platform. Teams that start with Power BI frequently find themselves expanding into Fabric data pipelines, Fabric Warehouses, and real-time analytics as their data needs grow. The platform has been designed to make that expansion natural.
Synapx is a Microsoft Power BI consultancy delivering implementations across financial services, construction, insurance, and the public sector. If you are evaluating Power BI or looking to get more from an existing deployment, get in touch for a free 30-minute consultation.
Conclusion
In conclusion, Power BI emerges as a pivotal tool for modern businesses, bridging the gap between raw data and actionable insights. Its dual role as a data visualisation tool and a comprehensive business intelligence platform empowers organisations to not only present their data in compelling, easy-to-understand formats but also to delve deep into advanced analytics and decision-making.
Power BI’s strengths lie in its versatility and integration capabilities. Whether it’s connecting to multiple data sources, transforming complex datasets, or creating interactive and customised reports and dashboards, Power BI is perfect for all. Its user-friendly interface caters to a wide range of users, from data analysts to decision-makers who may not have deep technical expertise, making advanced data analysis accessible to all.
Moreover, the platform’s ability to seamlessly integrate with other Microsoft products and services, along with its expanding suite of tools like Power Query and DAX, further enhances its utility and appeal. The use of AI capabilities and the provision for embedding sophisticated analytics into apps and websites extend its reach beyond traditional business intelligence boundaries.
From sales and revenue analysis to financial reporting, customer analytics, supply chain management, and beyond, Power BI proves to be an indispensable resource. Its scalability and flexibility, coupled with robust security and compliance features, ensure that it remains relevant and effective regardless of business size or sector.