Power BI and Tableau have dominated the business intelligence market for over a decade. Both are mature, capable platforms. But in 2026, the differences between them have become more strategic than technical and the right choice depends less on feature lists than on your organisation’s existing infrastructure, your users, and where your data platform is heading.
This comparison covers everything that actually matters: pricing, AI capabilities, Microsoft ecosystem fit, industry use cases, and platform trajectory. We will also give you a direct recommendation for the most common UK enterprise context.
Market Overview: Where Both Platforms Stand in 2026
| Criteria | Power BI | Tableau |
| Parent company | Microsoft | Salesforce |
| Integration strength | Microsoft 365, Azure, Dynamics, Teams | Salesforce, Google Cloud, multi-platform |
| Starting price | $10/user/month (Pro) | $15/user/month (Viewer — read only) |
| Mid-tier | $20/user/month (Premium Per User) | $42/user/month (Explorer) |
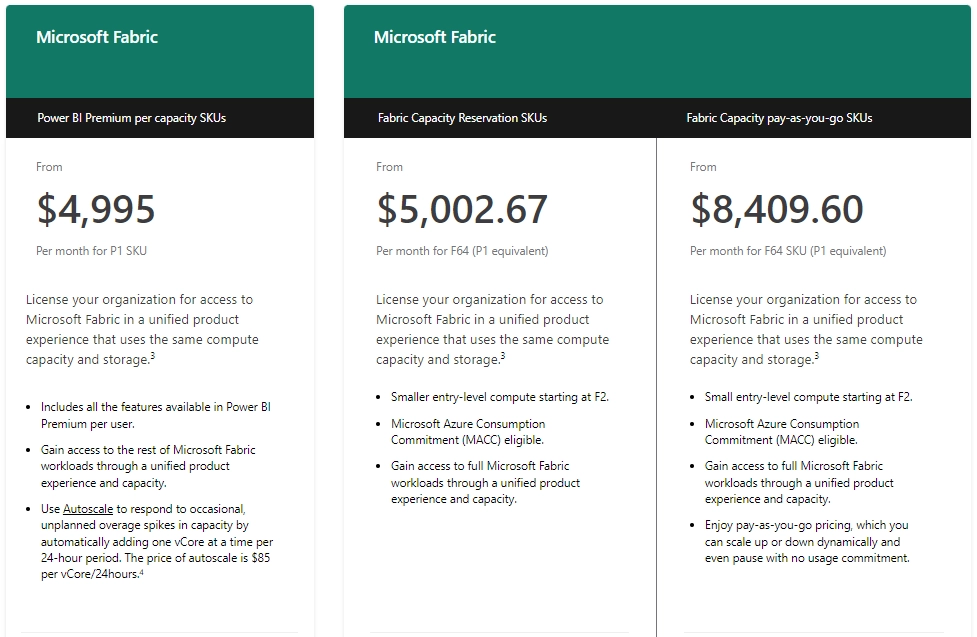
| Enterprise | Fabric capacity from ~£200/month (all users) | $75/user/month (Creator) + Cloud |
| AI capability | Copilot — natural language, embedded | Tableau Pulse — proactive metric monitoring |
| Primary users | Business users, finance, IT | Data analysts, marketing, data scientists |
| Strongest fit | Finance, construction, public sector, insurance | Marketing, analytics, multi-cloud enterprises |
Features Breakdown: Head-to-Head in 2026
Data Connectivity & Integration
- Tableau excels in blending disparate data sources and handling complex queries visually.
- Power BI wins if you’re deep into Excel, Azure, SQL Server, or Dynamics 365.
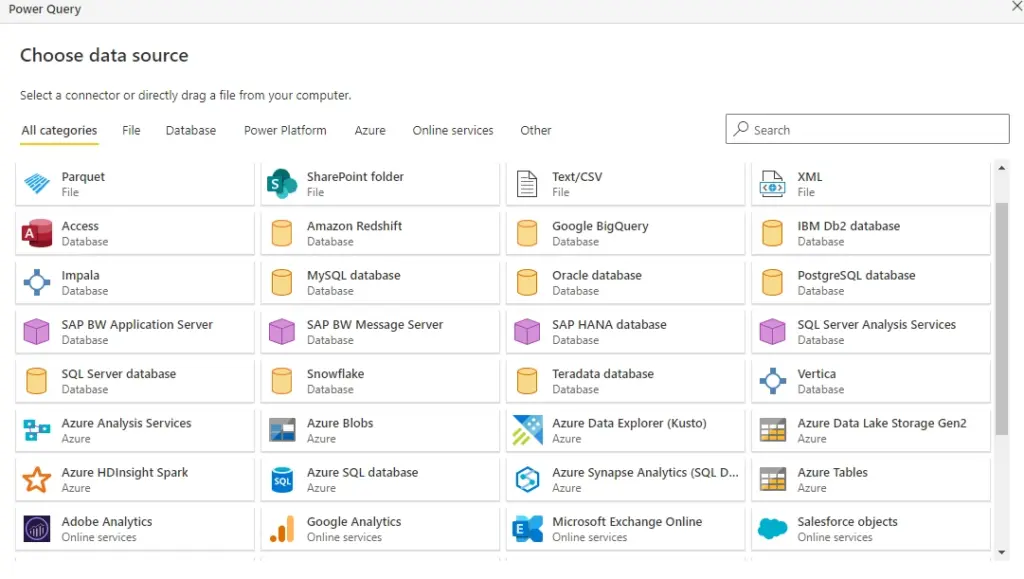
If your teams live in Microsoft 365, Power BI is seamless. If they need diverse, creative dashboards, Tableau shines.
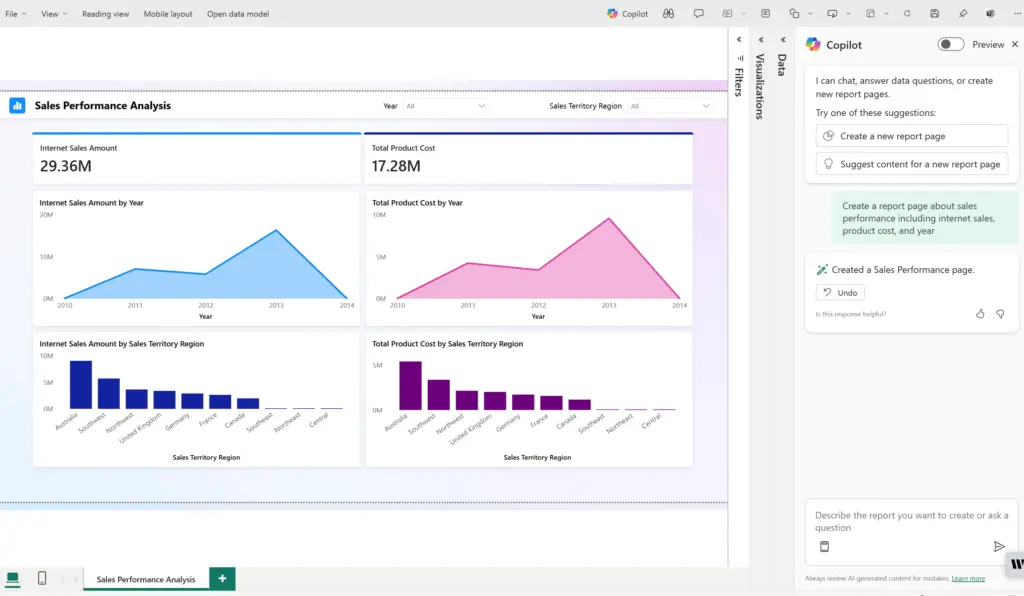
AI & Copilot Capabilities
Both platforms have significantly advanced their AI capabilities in 2026, moving beyond basic natural language queries into workflow-level intelligence.
- Power BI Copilot (2026 update) helps users generate complete reports from prompts, create DAX formulas automatically, summarize large datasets, and provide contextual narrative insights inside dashboards. With deeper integration into Microsoft Fabric and Azure AI, Copilot now supports semantic model assistance and enterprise-scale data environments.
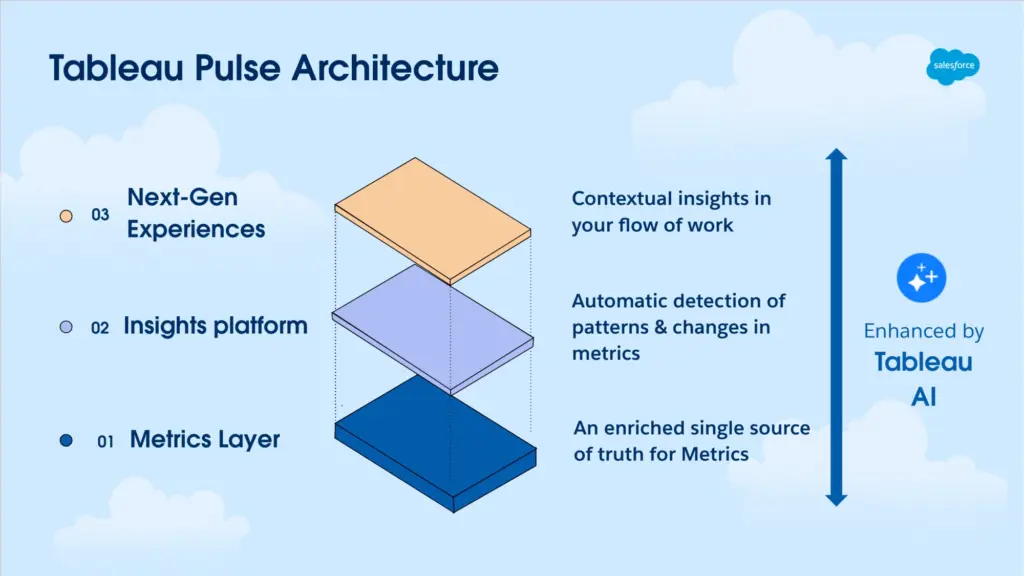
- Tableau Pulse, Tableau’s AI-driven metric layer, focuses on proactive insights. It automatically detects trends, anomalies, and performance changes, delivering contextual summaries directly in the user’s workflow. Rather than just building reports, Tableau emphasises continuous monitoring and smart metric tracking.
Tie. But Power BI may edge out for those already using Azure AI services.
Ease of Use
- Power BI’s interface is more intuitive for Excel power users and business teams.
- Tableau offers greater flexibility for analysts who love customisations.
Speed & Performance
Tableau generally renders large datasets faster but requires more initial configuration. Power BI handles large models well, especially when paired with Power BI Premium capacity.
Pricing in 2025: What’s the Cost of Insight?
| Tier | Power BI | Tableau |
| Free / Desktop | Power BI Desktop — free, local only | Tableau Public — free, public only |
| Individuals | $10/user/month (Pro) | $15/user/month (Viewer — read only) |
| Power users | $20/user/month (Premium Per User) | $42/user/month (Explorer) |
| Creators | Included in Pro | $75/user/month (Creator) |
| Enterprise capacity | Fabric F SKUs from ~£200/month (all users at F64+) | Tableau Cloud — custom enterprise pricing |
The gap widens significantly at enterprise scale. Power BI’s Fabric capacity model means that once an F64 or above subscription is in place, read-only report consumers no longer need individual Pro licences. Tableau’s per-user model scales linearly with headcount.
For large organisations with many report consumers relative to creators, Power BI’s capacity model almost always delivers a lower total cost of ownership.
Latest 2026 Features & Product Updates
The business intelligence landscape continues to evolve rapidly, and 2026 has introduced meaningful enhancements across both Power BI and Tableau. While both platforms were already mature and enterprise-ready in 2025, recent updates reflect a clear shift toward AI-driven analytics, platform consolidation, and workflow efficiency.
Power BI: Deeper AI Integration and Fabric Synergy
Microsoft has continued strengthening Power BI’s position within its broader analytics ecosystem. In 2026, much of the innovation centers around tighter integration with Microsoft Fabric, enabling organizations to unify data engineering, warehousing, and business intelligence under one platform.
Copilot capabilities have expanded significantly. Beyond simple report summaries, AI now assists with model refinement, DAX generation, automated insights, and contextual narrative explanations. This reduces dependency on advanced technical skills and accelerates dashboard development cycles.
Performance improvements in semantic models and dataset management have also made large-scale deployments more efficient. Enterprises managing high data volumes are benefiting from improved optimization, faster refresh cycles, and better governance controls.
Overall, Power BI’s 2026 evolution reinforces its strength as an end-to-end analytics solution embedded within the Microsoft ecosystem.
Tableau: Smarter Insights and Metric-Driven Analytics
Tableau’s 2026 updates focus heavily on delivering proactive, metric-driven intelligence. Tableau Pulse has matured into a more dynamic insight engine, allowing users to track key performance metrics with greater personalization and contextual analysis.
New capabilities emphasize pacing insights, metric prioritization, and smarter anomaly detection. Instead of waiting for users to explore dashboards manually, Tableau now pushes relevant insights based on business performance patterns.
Additionally, improvements in Tableau Cloud enhance scalability and cross-platform integrations, particularly for organizations operating in multi-cloud environments. Governance and data management tools have also been refined, enabling analytics teams to balance self-service flexibility with enterprise control.
Tableau continues to lead in visualization depth and storytelling capabilities, but its 2026 updates show a stronger pivot toward AI-assisted, proactive analytics rather than purely exploratory dashboards.
Industry Use Cases
Finance
Power BI dominates with:
- Native Excel integrations
- Compliance-ready Azure support
- Custom DAX formulas for financial modeling
Construction
Power BI is popular due to:
- Integration with project tools like MS Project, SharePoint, and Dynamics
- Field reporting features via Power Apps
Tableau offers:
- Visual storytelling for project data
- Site mapping and spatial analysis via Mapbox
Insurance
Both tools work great, but Power BI’s ease of use allows underwriting teams and actuaries to build dashboards without needing dev support.
IT & Tech
Tableau gives data engineers:
- Better control over visuals
- Smoother experience with data lakes
Power BI wins for CIOs focused on:
- Enterprise-wide adoption
- Role-based access, cost control
Ecosystem & Platform Strategy: Fabric vs Tableau Cloud
Power BI vs Tableau debate is increasingly about platform alignment rather than visualisation capabilities.
Microsoft Fabric + Power BI
Microsoft Fabric represents a unified analytics environment that brings together data engineering, data warehousing, real-time analytics, and business intelligence.
Within this ecosystem:
- Power BI acts as the visualization and reporting layer
- Fabric handles data transformation and governance
- Azure supports scalability and security
For enterprises already invested in Microsoft technologies, this creates a seamless end-to-end analytics architecture. Data flows more naturally across systems, and governance frameworks align with existing IT policies.
This integration significantly strengthens Power BI’s enterprise appeal in 2026.
Tableau Cloud Strategy
Tableau, now operating under Salesforce, continues expanding Tableau Cloud as a flexible, cloud-first analytics environment.
Unlike Fabric’s tightly integrated stack, Tableau emphasizes:
- Multi-cloud compatibility
- Strong API integrations
- Flexible deployment models
- Cross-platform accessibility
Organisations that operate in heterogeneous environments, especially those not deeply tied to Microsoft infrastructure, often prefer Tableau’s platform independence.
The ecosystem decision now carries more weight than feature comparison.
Power BI is often the strategic choice for Microsoft-centric enterprises seeking consolidation. Tableau Cloud appeals to organizations prioritizing flexibility, cross-platform architecture, and strong visualization leadership.
In many cases, the long-term data strategy will determine the BI tool, not the other way around.
Final Verdict: Power BI or Tableau in 2026?
Let’s sum it all up:
| Need | Best Choice |
| Cost-effectiveness | Power BI |
| Seamless Microsoft integration | Power BI |
| Better visual storytelling | Tableau |
| Advanced customisation | Tableau |
| AI integration | Tie |
| Cross-industry versatility | Power BI |
TL;DR: When to Choose Which?
Choose Power BI if you:
- Prioritise ease of use for business teams
- Already use Microsoft 365 or Azure
- Want lower TCO (total cost of ownership)
Choose Tableau if you:
- Need cutting-edge dashboard customizations
- Work in analytics-heavy or creative industries
- Value data storytelling more than cost savings
Want access to Microsoft Fabric at a lower cost? Power BI Premium includes Fabric capacity, giving you access to Microsoft’s unified data platform for data engineering, real-time analytics, and AI integration without paying separately for a Fabric license.
For even more value, explore how Xscale simplifies Fabric deployment and helps you future-proof your data estate.
Our Recommendation
For the majority of UK enterprises, particularly those already running Microsoft 365, Azure, and any combination of Dynamics, SharePoint, or Teams, Power BI is the right choice. The cost advantage at scale, the depth of Microsoft integration, the accessibility for non-technical users, and the trajectory of Copilot AI make it a stronger long-term investment.
Tableau is the right choice when: your organisation is primarily Salesforce-driven, your BI users are skilled data analysts who need maximum visualisation flexibility, or you operate across multiple cloud providers and need platform independence.
Synapx is a Microsoft Power BI consultancy with experience implementing BI solutions across financial services, construction, insurance, and the public sector. If you are evaluating Power BI or considering a migration from Tableau, get in touch to book a consultation.
To learn more about Power BI and its capabilities, visit our guide on What is Power BI and discover how “Using Power BI to Understand Your Data” can be the key to smarter business decisions. Contact us today for a free Power BI consultation!