The world of data analytics is constantly evolving, and staying ahead of the curve is crucial for any organisation. Microsoft has been at the forefront of this evolution, consistently innovating and refining its data platforms. One of the most significant recent developments is the introduction of Microsoft Fabric, a unified, end-to-end analytics platform that aims to bring together data warehousing, data engineering, data science, and business intelligence into a single, integrated experience.
For organisations heavily invested in Power BI, the natural question arises: how do you migrate to this new paradigm? This blog provides a comprehensive, step-by-step strategy for migrating from Power BI to Microsoft Fabric, looking ahead to the projected timeline and best practices for a successful transition by 2026.
The Rise of Microsoft Fabric: Why Migrate from Power BI?
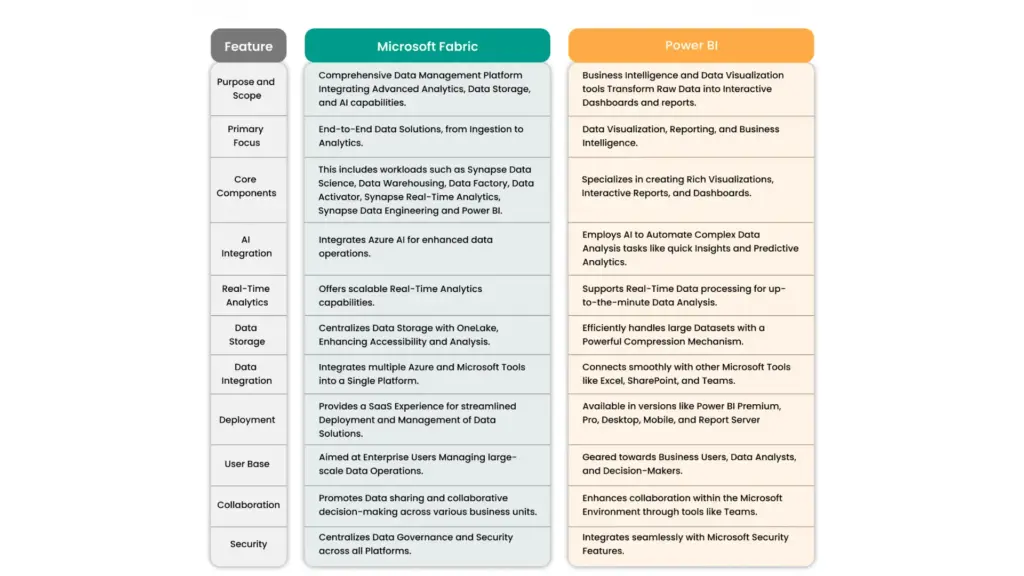
Power BI has been a dominant force in the business intelligence market, empowering users with powerful visualization and reporting capabilities. However, the data landscape has become increasingly complex, with a growing need to manage diverse data types, orchestrate complex data pipelines, and foster collaboration across different data roles. Microsoft Fabric addresses these challenges by offering a holistic solution.
Key advantages of Microsoft Fabric over a standalone Power BI deployment include:
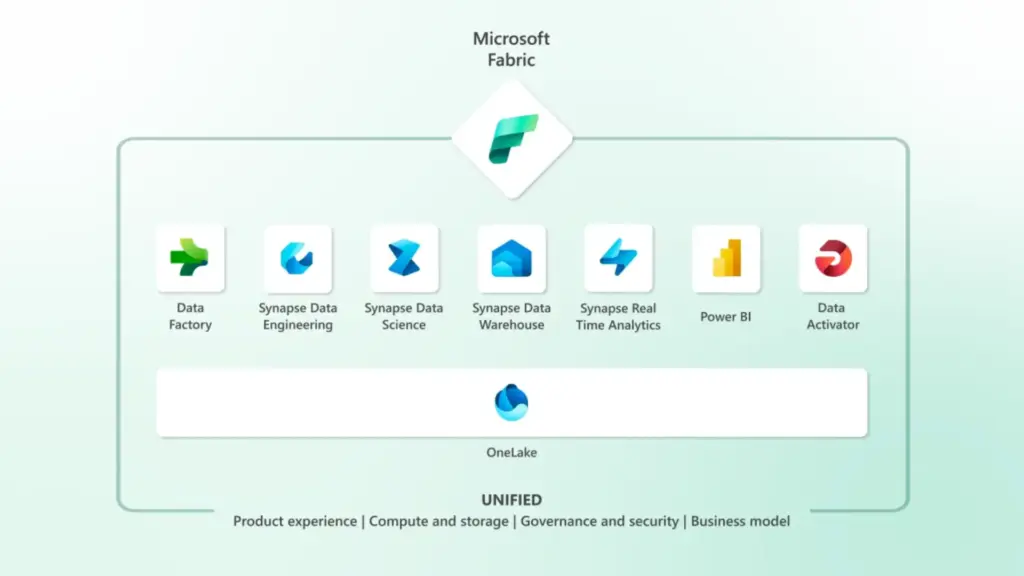
- Unified Experience: Fabric consolidates data warehousing (SQL Warehouses), data engineering (Spark), data science (Notebooks), real-time analytics (KQL Databases), and business intelligence (Power BI) into a single, seamless environment. This eliminates the need to stitch together disparate tools and services.
- Lakehouse Architecture: Fabric is built on a Lakehouse architecture, which combines the best features of data lakes and data warehouses. This allows for structured and unstructured data to be stored and processed efficiently, offering greater flexibility and scalability.
- AI Integration: Fabric is deeply integrated with AI and machine learning capabilities, enabling advanced analytics and predictive modelling directly within the platform.
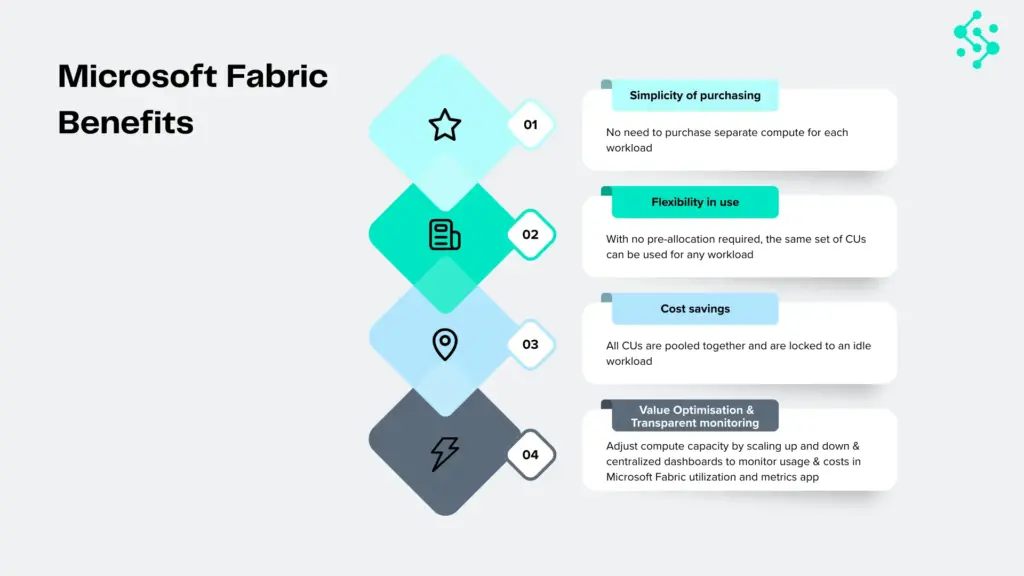
- Cost Efficiency: By consolidating multiple services into a single offering, Fabric can potentially lead to cost savings through streamlined management and optimised resource utilisation.
- Enhanced Collaboration: A unified platform fosters better collaboration among data engineers, data scientists, and business analysts, breaking down traditional silos.
While Power BI will continue to be a vital component within Fabric, the broader platform offers a more comprehensive solution for modern data challenges. The migration isn’t about abandoning Power BI, but rather about integrating it into a more powerful, unified ecosystem.
Understanding the Migration Landscape: Key Components and Considerations
Migrating from a mature Power BI environment to Microsoft Fabric involves understanding the core components of Fabric and how they relate to your existing Power BI setup.
Core Components of Microsoft Fabric:
- Data Lakehouse: The foundation of Fabric. It unifies data lakes and data warehouses, storing data in open formats like Delta Lake.
- Data Factory: For data integration and ETL/ELT pipelines, similar to Azure Data Factory.
- Spark Engine: For big data processing, data engineering, and advanced analytics using languages like Python and Scala.
- SQL Warehouses: For traditional data warehousing workloads with T-SQL compatibility.
- KQL Databases: Optimized for real-time analytics and log data analysis.
- Power BI Integration: The familiar BI experience is deeply embedded within Fabric, allowing for the creation of reports and dashboards directly on Fabric data sources.
- Data Science: Tools for building and deploying machine learning models.
Key Considerations for Migration:
- Data Sources: Identify all your current data sources connected to Power BI. These will need to be integrated into Fabric.
- Data Models: Analyze your existing Power BI data models (datasets). Some may be directly transferable, while others might need to be refactored to leverage Fabric’s Lakehouse or SQL Warehouse capabilities.
- Reports and Dashboards: Existing Power BI reports and dashboards will need to be repointed to new Fabric data sources or potentially rebuilt to take advantage of Fabric’s features.
- Dataflows and Datamarts: Understand how your current Power BI dataflows and datamarts will translate into Fabric’s data engineering and warehousing components.
- Security and Governance: Plan for how security roles, permissions, and data governance policies will be implemented in Fabric.
- User Adoption and Training: Prepare your users for the new environment and provide adequate training.
- Cost Management: Understand the new pricing model for Fabric and how it compares to your current Power BI costs.
The Migration Strategy: A Phased Approach
A successful migration to Microsoft Fabric requires a strategic, phased approach. Rushing the process can lead to errors, data inconsistencies, and user frustration. Here’s a recommended step-by-step strategy, broken down into phases:
Phase 1: Assessment and Planning
This initial phase is critical for laying a solid foundation. It involves understanding your current state, defining your future state, and creating a detailed migration roadmap.
Step 1: Form a Migration Team
Assemble a dedicated team with representatives from BI, Data Engineering, IT, and business stakeholders. This team will own the migration process.
Step 2: Inventory Existing Power BI Assets
- Data Sources: Document all data sources currently used by Power BI (databases, APIs, files, etc.).
- Datasets: List all Power BI datasets, their complexity, and their dependencies.
- Dataflows and Datamarts: Catalog all existing dataflows and datamarts, noting their logic and purpose.
- Reports and Dashboards: Identify all reports and dashboards, their audience, and their business criticality.
- Security and Access: Document current security roles, row-level security (RLS) implementations, and access permissions.
- Data Refresh Schedules: Record all scheduled data refreshes.
Step 3: Define the Target Fabric Architecture
- Understand Your Data Needs: Will you primarily leverage the Lakehouse, SQL Warehouses, or a combination?
- Data Ingestion Strategy: How will data be ingested into Fabric? Will you use Data Factory pipelines, direct connections, or other methods?
- Data Transformation Strategy: Where will data transformations occur? In Data Factory, Spark, or within SQL Warehouses?
- BI Layer: How will Power BI reports connect to Fabric data sources? Will you create new semantic models within Fabric or repoint existing ones?
Step 4: Prioritize Migration Scope
- Start Small: Identify a pilot project or a less critical set of reports/datasets for the initial migration. This allows you to learn and refine the process.
- Business Criticality: Prioritize the migration of mission-critical reports and datasets to ensure business continuity.
- Complexity: Consider migrating simpler datasets and reports first to build momentum and expertise.
Step 5: Develop a Detailed Migration Plan
- Timeline: Set realistic milestones for each phase.
- Resource Allocation: Assign roles and responsibilities.
- Testing Strategy: Define how migrated assets will be tested for accuracy and performance.
- Rollback Plan: Have a contingency plan in case of unforeseen issues.
- Training Plan: Outline the training required for the migration team and end-users.
Step 6: Set Up a Fabric Workspace
Begin exploring Microsoft Fabric. Create a dedicated workspace for testing and development. Familiarize yourself with the Fabric interface and its capabilities.
Phase 2: Development and Testing
This phase involves the actual migration of data, models, and reports, coupled with rigorous testing.
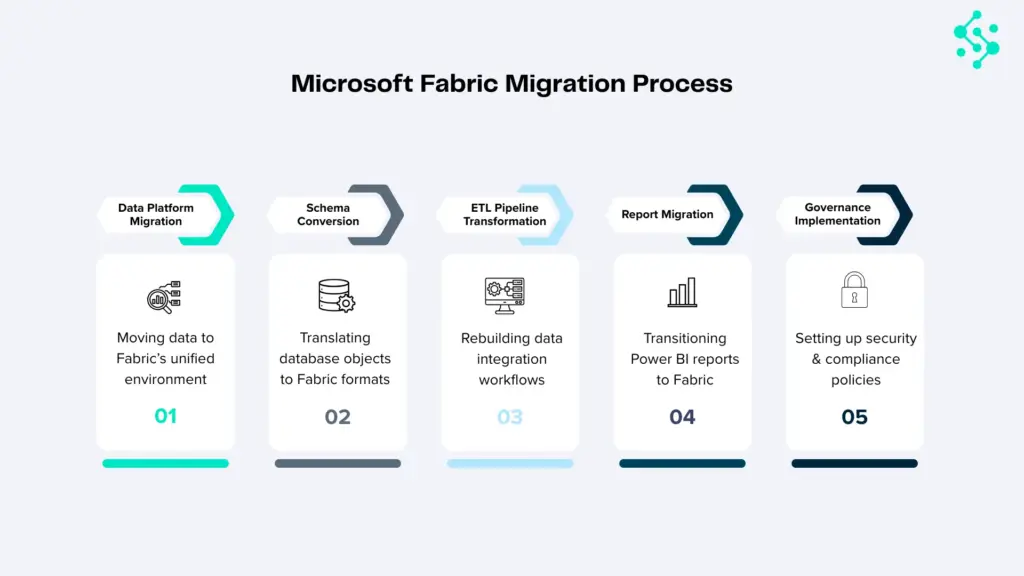
Step 7: Migrate Data Sources and Ingestion Pipelines
- Connect to Data Sources: Configure Fabric’s Data Factory or other connectors to access your original data sources.
- Build Ingestion Pipelines: Develop new data pipelines within Fabric to ingest data into the Lakehouse or other chosen Fabric storage. For existing Power BI dataflows, you’ll likely need to re-engineer them using Fabric’s Data Factory or Spark capabilities.
- Data Transformation: Implement data transformation logic within Fabric pipelines, leveraging Spark for complex transformations or SQL for warehouse-based transformations.
Step 8: Rebuild or Refactor Data Models
- Lakehouse Approach: If using the Lakehouse, consider building new Delta Lake tables and potentially creating a semantic model (dataset) in Power BI that connects to these tables.
- SQL Warehouse Approach: If a traditional data warehouse structure is preferred, load data into a Fabric SQL Warehouse and build your Power BI semantic model on top of it.
- Optimize Models: Refactor existing Power BI data models to optimize performance and leverage Fabric’s capabilities. This might involve simplifying relationships or choosing appropriate data types.
Step 9: Migrate or Rebuild Reports and Dashboards
- Repoint Existing Reports: For simpler reports, you might be able to repoint existing Power BI reports to the new Fabric semantic models.
- Rebuild Reports: For more complex reports or those that need to leverage new Fabric features, you may need to rebuild them within the Fabric Power BI experience.
- Utilize Fabric’s BI Capabilities: Explore creating reports directly within Fabric, taking advantage of its native integration.
Step 10: Implement Security and Governance
- Fabric Security Model: Configure workspaces, roles, and permissions within Fabric.
- Data Access Control: Implement fine-grained access control for data within the Lakehouse and SQL Warehouses.
- Row-Level Security (RLS): Re-implement RLS in the new Fabric semantic models.
Step 11: Rigorous Testing
- Data Validation: Compare data between the old Power BI environment and the new Fabric environment to ensure accuracy and completeness.
- Report Validation: Verify that reports and dashboards render correctly and display accurate information.
- Performance Testing: Test the performance of data ingestion, model refreshes, and report rendering. Identify and address any bottlenecks.
- User Acceptance Testing (UAT): Involve end-users to test the migrated assets and gather feedback.
Phase 3: Deployment and Optimization
This final phase focuses on rolling out the migrated solution and continuously improving its performance and usability.
Step 12: Pilot Deployment
- Deploy the migrated solution to a pilot group of users.
- Gather feedback and make necessary adjustments.
Step 13: Full Deployment
- Gradually roll out the migrated solution to the entire organization.
- Communicate clearly with users about the changes and provide support.
Step 14: Decommission Old Power BI Assets
- Once the migration is complete and users are comfortable with the new Fabric environment, begin decommissioning the old Power BI infrastructure.
- Ensure all critical data and reports have been successfully migrated before decommissioning.
Step 15: Ongoing Optimization and Training
- Performance Tuning: Continuously monitor performance and optimize data pipelines, models, and queries.
- User Training: Provide ongoing training to users on new Fabric features and best practices.
- Leverage New Features: Stay updated with Microsoft’s Fabric roadmap and explore new features that can further enhance your analytics capabilities.
Key Considerations for Specific Components:
Migrating Power BI Datasets
- DirectQuery vs. Import: Understand how your current connection modes will translate. Fabric’s Lakehouse and SQL Warehouses can support both.
- Data Model Complexity: Highly complex Power BI models with intricate DAX calculations might require careful refactoring. Consider breaking down large models or optimizing DAX.
- Data Types: Ensure data types in Fabric align with those expected by your Power BI semantic models.
Migrating Power BI Dataflows and Datamarts
Dataflows: Power BI dataflows are essentially ETL processes. In Fabric, these will likely be replaced by Data Factory pipelines or Spark jobs. You’ll need to re-engineer the data transformation logic.
Datamarts: Datamarts in Power BI provide a self-service data warehousing solution. In Fabric, the SQL Warehouse component will serve a similar purpose, offering more robust capabilities. Migrating datamarts will involve loading data into a SQL Warehouse and potentially rebuilding associated semantic models.
Migrating Power BI Reports and Dashboards
- Connectivity: The primary task is to repoint the Power BI reports to the new semantic models hosted within Fabric.
- Visualizations: Most standard Power BI visualizations should transfer seamlessly. However, custom visuals might require re-evaluation.
- Performance: Ensure that the underlying data sources in Fabric are optimized for query performance to maintain report responsiveness.
Challenges and How to Overcome Them
- Learning Curve: Microsoft Fabric is a broad platform. Investing in training for your team is essential. Microsoft Learn offers extensive resources.
- Data Consistency: Ensuring data integrity throughout the migration process requires meticulous validation and testing.
- Downtime: Plan for minimal disruption. Phased rollouts and clear communication can help manage user expectations.
- Cost Management: Monitor Fabric usage closely to avoid unexpected costs. Utilize Fabric’s monitoring tools.
- Change Management: Effectively communicating the benefits of Fabric and managing user adoption is crucial for long-term success.
The Future of Analytics with Microsoft Fabric
Microsoft Fabric represents a significant leap forward in unified data analytics. By migrating from a standalone Power BI deployment to Fabric, organizations can unlock a more integrated, powerful, and scalable data ecosystem. While the transition requires careful planning and execution, the benefits of a consolidated platform, enhanced AI capabilities, and a future-proof architecture are substantial.
The projected timeline of 2026 for widespread adoption suggests that now is the time to start planning and preparing. By following a structured, phased approach, organizations can navigate the
complexities of migration and position themselves to harness the full potential of Microsoft Fabric for data-driven decision-making.
Ready To Migrate?
We run a complimentary 30-minute Fabric Discovery Workshop with a Synapx Microsoft MVP. You walk away with a one-page Fabric Opportunity Summary that maps your current state against Fabric readiness indicators, identifies the gaps that matter, and gives you an honest view of timeline, complexity, and indicative cost.
If you would like to book a 30-minute Fabric Discovery Workshop with one of our Microsoft Fabric MVPs, contact us.