When it comes to business intelligence tools in 2025, Power BI and Tableau continue to dominate conversations in boardrooms, IT departments, and financial strategy meetings. But with AI integration, pricing model shifts, and industry-specific needs evolving rapidly, many decision-makers are asking the same question:
“Should we invest in Power BI or Tableau this year?”
Well, we’ve done the heavy lifting for you. In this blog, we’ll pit the two platforms against each other using the latest updates, pricing, features, and real-world applications across industries like insurance, construction, finance, and IT. Let’s dive right in.
Market Overview: Where Power BI and Tableau Stand in 2025
Power BI (by Microsoft) and Tableau (by Salesforce) are both leading BI tools, but they cater to slightly different audiences and tech ecosystems.
| Criteria | Power BI | Tableau |
| Parent Company | Microsoft | Salesforce |
| Integration Focus | Microsoft 365, Azure, Teams | Salesforce, Google Cloud |
| Pricing (2025) | More affordable, especially for enterprises already in the Microsoft ecosystem | Premium pricing, more flexible visual design options |
| User Base | Strong in SMBs, IT, and finance | Popular in marketing, analytics, and large enterprises |
Features Breakdown: Head-to-Head in 2025
Data Connectivity & Integration
- Tableau excels in blending disparate data sources and handling complex queries visually.
- Power BI wins if you’re deep into Excel, Azure, SQL Server, or Dynamics 365.
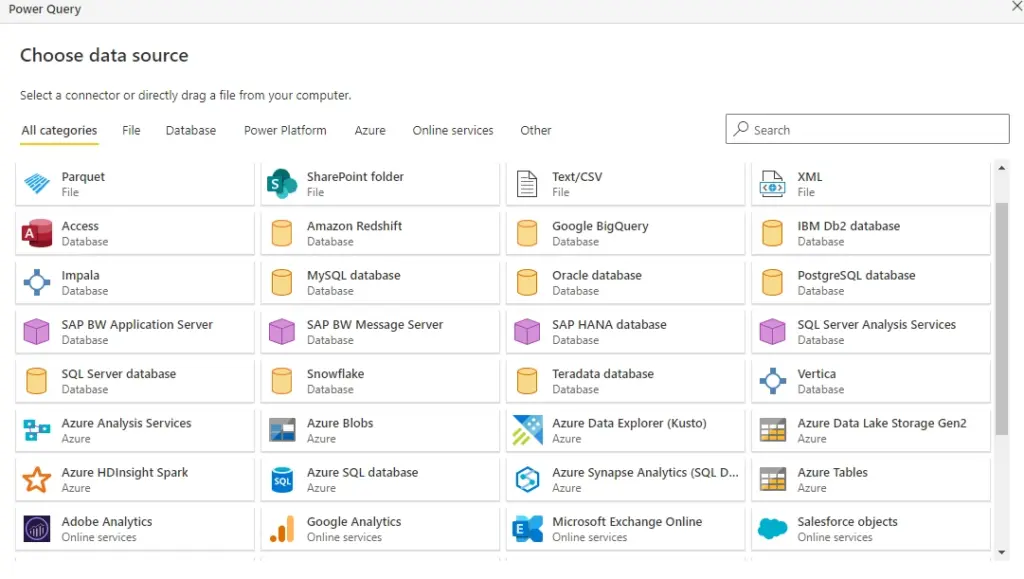
If your teams live in Microsoft 365, Power BI is seamless. If they need diverse, creative dashboards, Tableau shines.
AI & Automation
Both platforms made major strides in AI this year.
- Power BI’s Copilot (2025 update) helps users generate visuals using natural language and perform predictive analytics with Azure ML baked right in.
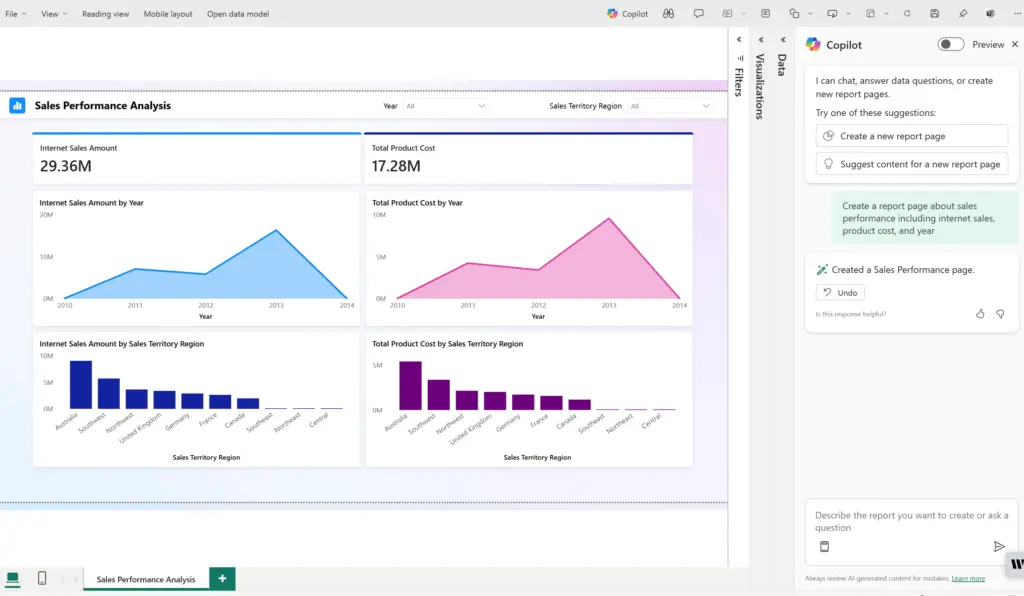
- Tableau Pulse, Tableau’s answer to AI alerts and smart data storytelling, uses NLP to help surface insights from huge datasets.

Tie. But Power BI may edge out for those already using Azure AI services.
Ease of Use
- Power BI’s interface is more intuitive for Excel power users and business teams.
- Tableau offers greater flexibility for analysts who love customisations.
Speed & Performance
Tableau generally renders large datasets faster but requires more initial configuration. Power BI handles large models well, especially when paired with Power BI Premium capacity.
Pricing in 2025: What’s the Cost of Insight?
| Tool | Entry-Level (per user/month) | Enterprise/Pro Tier | Notes |
| Power BI | £8.20 | £16.40 (Pro) / Premium P1 (from £4,105/month) | Better for larger MS-based orgs |
| Tableau | £15.00 | £75.00 (Creator) | Costlier, but with more dashboard flexibility |
If cost is key, Power BI wins. But Tableau justifies its higher price with design freedom and deeper analytics capabilities.
Industry Use Cases
Finance
Power BI dominates with:
- Native Excel integrations
- Compliance-ready Azure support
- Custom DAX formulas for financial modeling
Construction
Power BI is popular due to:
- Integration with project tools like MS Project, SharePoint, and Dynamics
- Field reporting features via Power Apps
Tableau offers:
- Visual storytelling for project data
- Site mapping and spatial analysis via Mapbox
Insurance
Both tools work great, but Power BI’s ease of use allows underwriting teams and actuaries to build dashboards without needing dev support.
IT & Tech
Tableau gives data engineers:
- Better control over visuals
- Smoother experience with data lakes
Power BI wins for CIOs focused on:
- Enterprise-wide adoption
- Role-based access, cost control
Community, Ecosystem & Support
- Power BI has a thriving community of Microsoft MVPs, countless templates, and forum support.
- Tableau has Tableau Public, a massive online gallery of public dashboards and a dedicated data artist community.
Both offer strong documentation and certifications, but Microsoft’s Power Platform ecosystem (Power BI, Power Apps, Power Automate) adds more value if you’re building custom business solutions.
Final Verdict: Power BI or Tableau in 2025?
Let’s sum it all up:
| Need | Best Choice |
| Cost-effectiveness | Power BI |
| Seamless Microsoft integration | Power BI |
| Better visual storytelling | Tableau |
| Advanced customisation | Tableau |
| AI integration | Tie |
| Cross-industry versatility | Power BI |
TL;DR: When to Choose Which?
Choose Power BI if you:
- Prioritise ease of use for business teams
- Already use Microsoft 365 or Azure
- Want lower TCO (total cost of ownership)
Choose Tableau if you:
- Need cutting-edge dashboard customizations
- Work in analytics-heavy or creative industries
- Value data storytelling more than cost savings
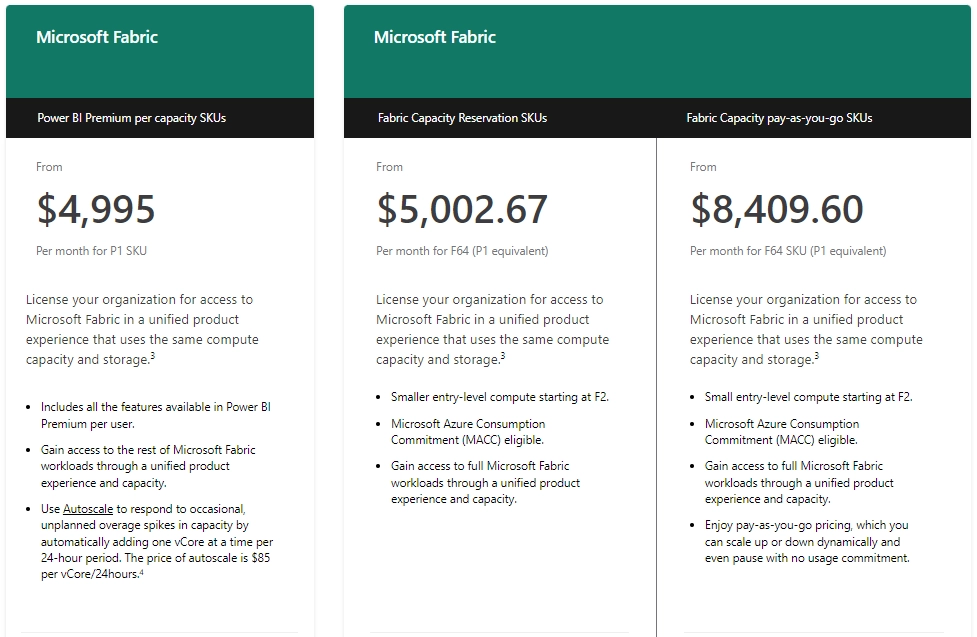
Want access to Microsoft Fabric at a lower cost? Power BI Premium includes Fabric capacity, giving you access to Microsoft’s unified data platform for data engineering, real-time analytics, and AI integration without paying separately for a Fabric license.
For even more value, explore how Xscale simplifies Fabric deployment and helps you future-proof your data estate.
Need help implementing BI solutions?
Synapx specialises in helping clients choose, implement, and optimise Power BI tools, integrating Power BI into a Microsoft-based ecosystem. Check out our case study on how we helped a client unify their data sources using Power BI, enabling smarter, data-driven decisions across their business.
To learn more about Power BI and its capabilities, visit our guide on What is Power BI and discover how “Using Power BI to Understand Your Data” can be the key to smarter business decisions. Contact us today for a free Power BI consultation!

